Urban Development Planning
Where Should Delhi Put Its Next EV Charging Station? A Grid-Aware Siting Model for Government
September 28, 2026

Client: Government of NCT of Delhi, Delhi Transco Limited (the designated single nodal agency for EV charging infrastructure), in coordination with Delhi’s DISCOMs and the State EV Nodal Agency
Engagement: Advise on a data-driven method for selecting new public EV charging station sites, replacing the current land-availability-driven process
Key Decision: Should Delhi adopt an algorithmic siting model that screens candidate sites by demand, existing coverage, and local grid capacity before land is allocated, rather than after
Roughly 26,000 to 27,000+ estimated shortfall in EV charging points in Delhi, comparing an installed base estimated at 8,800 to 10,000 against a stated policy requirement of 36,150, both figures are estimates rather than a precise census [1]
84% of chargers in an IEEFA 2024 spot-sample survey across Delhi were found non-functional, largely due to theft, damage and lack of maintenance [2]
227 MW Delhi’s EV charging load as of 2026, up from 24 MW in 2018-19, a nearly ninefold increase, with a further rise to a projected 375 MW within two years [3]
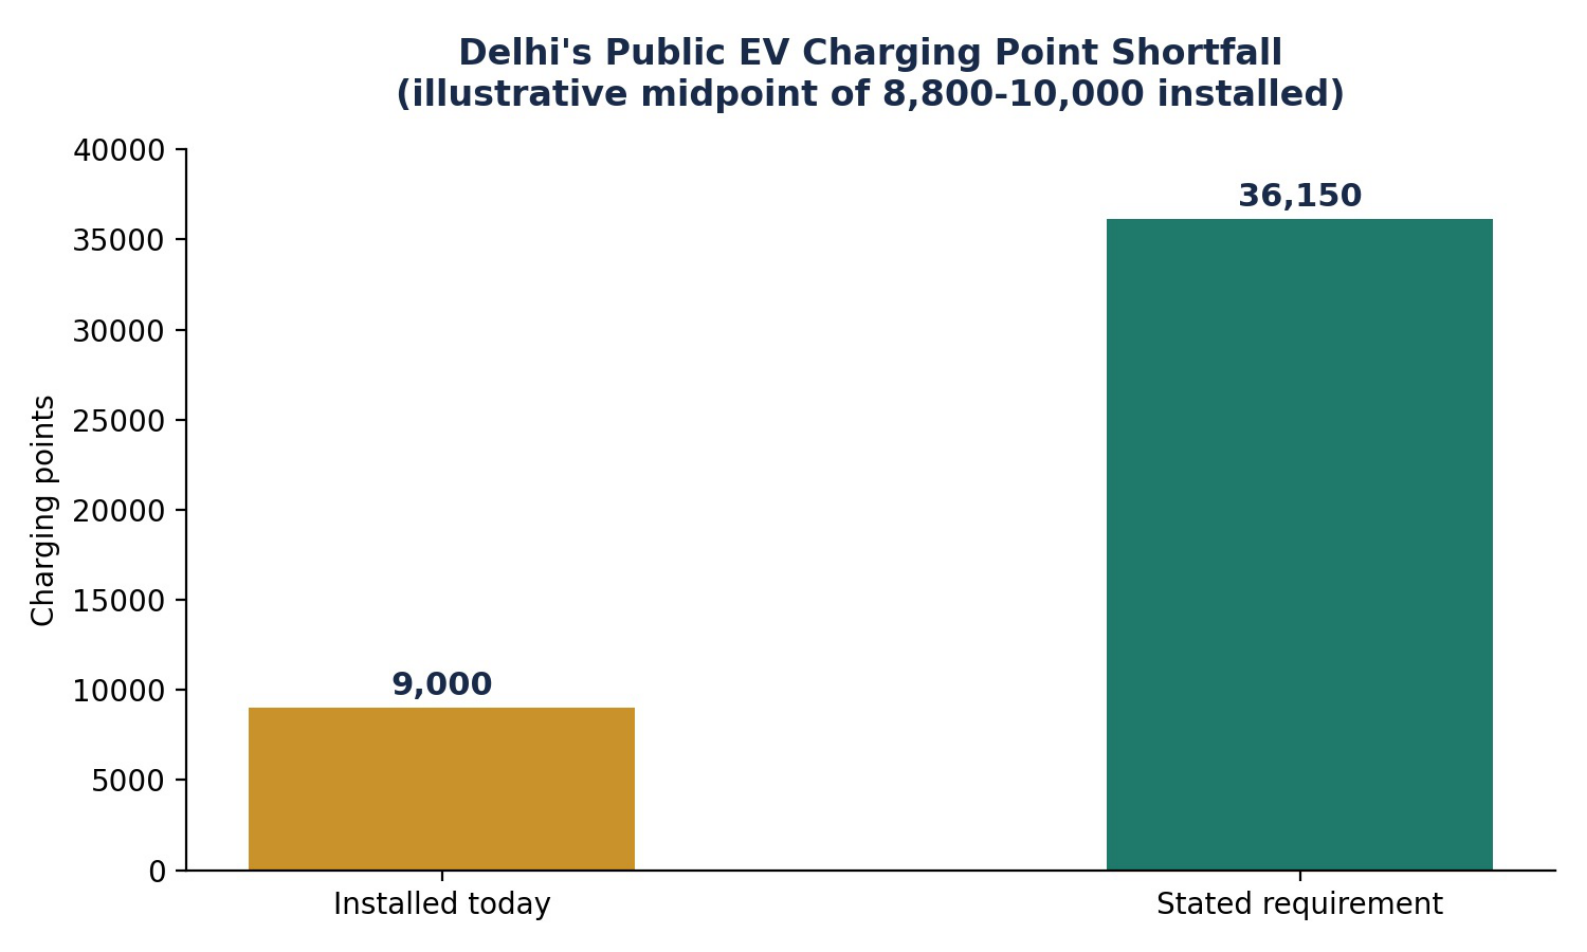
Delhi’s public EV charging point shortfall
Executive Summary
Delhi has built one of India’s largest public EV charging networks, and it is still not where drivers need it, and not where the grid can safely support it. The city’s flagship 2021 charging rollout selected roughly 100 sites primarily by aggregating available public land, with about 70 percent of those sites being Delhi Metro parking areas [4]. That is a reasonable way to move quickly, but it means sites were chosen by land availability first, not by where demand is highest or where the local electricity grid has room to carry the load. The result is visible in the numbers: a stated shortfall of over 27,000 charging points against demand, an EV charging load that has grown nearly ninefold in under a decade and is straining local infrastructure, and independent surveys finding a large share of existing chargers non-functional.
This case study argues that Delhi does not need a bigger charging rollout, it needs a better method for choosing where the rollout goes. The Central Electricity Authority and the PM E-DRIVE scheme already provide funding and guidelines for public charging infrastructure, and Delhi’s own EV Policy has designated Delhi Transco Limited as the single nodal agency responsible for planning and grid integration. What is missing is not an institutional mandate or access to a national funding pool, it is a repeatable, data-driven method for ranking candidate sites that puts local grid capacity into the site-selection decision itself, rather than treating it as a problem to be solved after a site is already chosen.
We recommend a targeted pilot: a Grid-Aware Charging Site Suitability Model, a weighted scoring system that ranks every part of the city by charging demand, existing coverage gaps, and local transformer headroom, the same transformer-capacity data proposed for legalising informal e-rickshaw charging in a related ICG case study. Modelled on real Delhi data sources already in government hands, this model can be built and piloted in one DISCOM zone within a single budget cycle, using data Delhi already collects rather than requiring a new survey or a new scheme. An interactive demonstration of the model’s mechanism, built on illustrative rather than measured data, is described in Section 4.4 and linked there.
1. The Challenge
Delhi’s public charging shortfall is not primarily a shortage of investment or ambition. It is a shortage of a systematic method for deciding where investment goes.
Sites have been chosen by land availability, not by demand or grid capacity. Delhi’s 2021 public-private charging rollout, coordinated by the Dialogue and Development Commission and executed through Delhi Transco Limited, assembled roughly 100 sites primarily from land already controlled by public agencies, with about 70 percent being Delhi Metro parking areas [4]. This is a sensible way to move quickly on a first rollout, but it means the sites reflect which government body happened to have available parking, not a ranked assessment of where the most people need to charge or where the grid can support them.
National guidelines point to discretionary, criteria-based selection rather than a prescribed method. Under PM E-DRIVE, state nodal agencies are asked to identify high-priority locations considering traffic patterns, proximity to commercial spaces, land accessibility and sufficient power supply, then submit consolidated proposals [5]. These are reasonable criteria, but there is no specified algorithm or scoring method for weighing them against each other, which means two different officials reviewing the same set of candidate sites could reasonably rank them in different orders.
The result is a network that has grown without growing evenly. Charging demand and installed capacity cluster in South and Central Delhi, while East Delhi and outer districts remain comparatively thin [6]. A large share of Delhi’s charging electricity consumption, over 40 percent of the national total, is concentrated in a city whose network was never ranked by where that demand actually sits [3].
Existing chargers are failing at a rate that suggests siting and maintenance were not planned together. A 2024 spot survey by the Institute for Energy Economics and Financial Analysis found that roughly 84 percent of sampled public chargers across South, Central, West and East Delhi were non-functional, largely due to connector and cable theft and a lack of maintenance [2]. A charger sited without regard to whether it can realistically be serviced and secured is a charger likely to fail.
The grid is already showing strain from unplanned load growth. Delhi’s EV charging load rose from 24 MW in 2018-19 to over 227 MW currently, a nearly ninefold increase, and is projected to reach 375 MW within two years [3]. Industry analysts have noted that charger additions in areas where transformer capacity is already stressed face connection delays and cost overruns, and that operators must independently verify feeder-level headroom for every site rather than relying on policy commitments alone [7]. This is the same underlying constraint identified in ICG’s companion case study on informal e-rickshaw charging: local transformer capacity is rarely measured or used as a planning input, even though it is often the actual bottleneck.
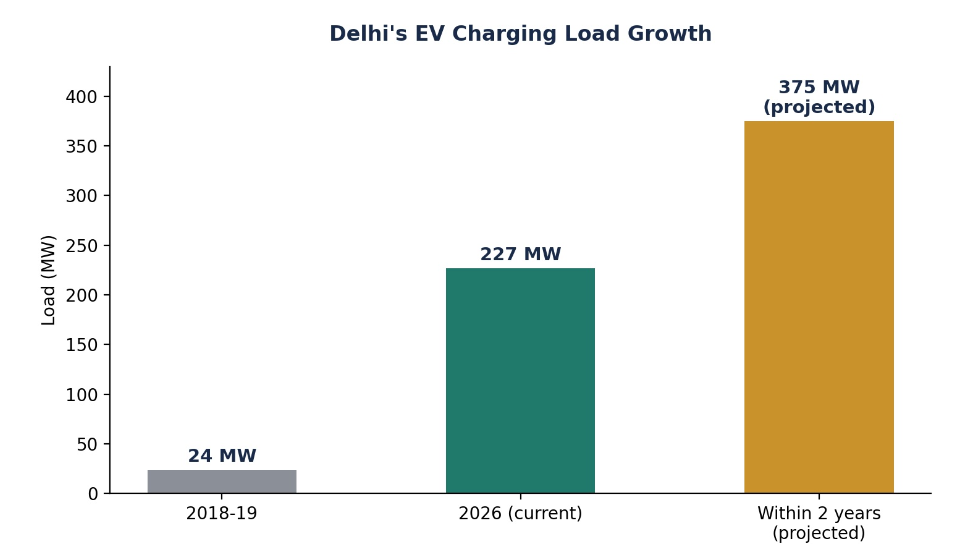
Delhi’s EV charging load growth
Delhi’s own new policy direction confirms this gap needs fixing. The city’s draft EV Policy 2.0 designates Delhi Transco Limited as the single nodal agency for charging infrastructure planning and grid integration, and sets targets of a public charging point within roughly every 5 kilometres and a charging or swapping station per square kilometre [8]. Naming one accountable agency is the right structural fix, but it does not by itself supply the method that agency needs to actually rank and choose sites.
Taken together, this is a systems gap, not a funding gap. Delhi has access to national funding, an institutional mandate, and a newly consolidated nodal agency. What it does not yet have is a repeatable way to decide, before land is committed, whether a candidate site is actually where demand, coverage gaps and grid capacity all point.
2. The Core Problem and Strategic Questions
The task is not to build more charging stations everywhere. It is to build a method that tells Delhi Transco Limited which specific locations deliver the most benefit per station, before a site is chosen rather than after. The questions that matter are:
Where in the city does charging demand concentrate, and where are the existing coverage gaps relative to that demand.
Which candidate sites have distribution transformers or feeders with enough spare capacity to support a new station without costly upgrades or delays.
What combination of demand, coverage gap and grid headroom should determine priority, and how sensitive is that ranking to the weights chosen.
How many new stations, and at what combined cost, would close a meaningful share of the current 27,000-point shortfall.
What is a realistic sequence for testing this method in one part of the city before recommending it citywide.
3. Diagnosing the Opportunity: A Two-Stage Feasibility and Suitability Model
Rather than ranking sites informally against a checklist, or folding grid capacity into a single weighted average where a high-demand score could mask a genuine grid problem, we propose a two-stage model that treats grid capacity as a feasibility gate first and a ranking factor second.
Stage 1, Feasibility Gate. A candidate site is excluded from consideration, not merely penalised, if its serving distribution transformer or feeder cannot support the required charging load without an upgrade exceeding a defined cost or time threshold. This matters because grid capacity is not a tradeable input the way demand and coverage are. A site with exceptional demand is still infeasible today if the transformer serving it cannot carry the load, and a weighted average can hide that by letting a high demand score compensate for a low headroom score, recommending a site that cannot actually be connected on a reasonable timeline.
Stage 2, Suitability Ranking. Among the sites that pass the feasibility gate, a suitability score ranks them using the two remaining, genuinely tradeable factors:
Suitability = 0.55 (Demand Density) + 0.45 (Coverage Gap)
Demand Density reflects concentration of registered electric vehicles and traffic activity in an area, drawn from Vahan registration data by RTO zone and available traffic or trip data [9].
Coverage Gap reflects distance from the nearest existing public charging station, drawn from the Delhi Open Database of EV charging and swapping stations, which every operator in the city is legally required to report into [11].
A site excluded at Stage 1 is not necessarily abandoned. If it sits in a high-demand area, it becomes a candidate for a planned grid upgrade rather than an immediate rollout site, which is a different and more useful signal to government than treating it as simply low-priority. This distinction matters: the model’s real value is helping Delhi Transco Limited sequence and allocate between “build now” and “upgrade then build” sites, not just avoiding grid problems outright, since some high-demand, low-headroom sites are exactly where a grid upgrade is worth funding.
Every part of the city can be scored on demand and coverage gap using data Delhi already publishes. The one input that cannot yet be measured systematically is grid headroom, since no agency currently tracks transformer-level spare capacity across the city the way it tracks traffic or vehicle registrations. That is the same measurement gap identified in ICG’s e-rickshaw charging case study, and closing it here does double duty, the same sensing layer would serve both the informal-charging pilot and this citywide siting model.
The Stage 1 feasibility threshold and the Stage 2 weights above are illustrative starting values, not derived from calibrated data. A pilot’s first task should be to test both how many real candidate sites the feasibility gate actually excludes, and how sensitive the Stage 2 ranking is to its weights, exactly as recommended for the parallel readiness index in the e-rickshaw case study.
4. The Solution: A Grid-Aware Charging Site Suitability Model
The model has two data layers feeding a two-stage decision process. Two of the inputs, demand and coverage gap, can be built today from data Delhi already publishes. The third, grid headroom, is what makes this approach genuinely different from how sites are chosen today, and it acts as a gate, not just another score to average in.
4.1 The demand and coverage layer
Delhi is divided into a grid of cells, roughly 500 metres across, following the resolution used in comparable academic siting studies for the city [12]. For each cell, two scores are calculated: a demand score, combining electric vehicle registration density from Vahan with available traffic and point-of-interest data, and a coverage-gap score, measuring distance to the nearest existing public station in the Delhi Open Database. A cell with high registered EV density and no nearby charger scores highly on both counts, exactly the profile of an underserved area.
This layer alone is not new. A published Infosys and Esri India framework, and at least one academic study specific to Delhi, already build comparable demand and coverage layers using geographic information system tools [13]. Where every existing approach stops short is the next layer.
4.2 The grid headroom layer, applied as a feasibility gate
Each grid cell is also scored on how much spare capacity the local distribution transformer or feeder serving that cell actually has. This is measured the same way proposed in ICG’s e-rickshaw charging case study: a current and voltage sensor on the transformer’s low-tension output lines, reporting real-time load against rated capacity. Where dedicated sensors are not yet installed, Delhi’s State Load Despatch Centre real-time feeder loading data can serve as an interim, coarser proxy [10].
This layer is applied before, not alongside, the demand and coverage scoring. A cell whose serving transformer cannot support the required load without an upgrade exceeding a defined cost or time threshold is excluded from the immediate rollout list altogether, regardless of how strong its demand or coverage-gap score is. This avoids the flaw in a simple weighted average, where an exceptional demand score could mathematically outweigh a poor grid score and recommend a site that cannot actually be connected in a reasonable timeframe. A cell excluded this way is not discarded, it is instead flagged as a candidate for a planned grid upgrade, which is a genuinely different and more useful recommendation than ranking it low alongside cells that simply have weak demand.
4.3 Why this is a new operating model, not a new technology
Every individual component here already exists. Vahan registration data, the Delhi Open Database, and feeder loading data are all public. Multi-criteria GIS scoring for charging-station siting has been published for Indian contexts, including one framework that explicitly weighs proximity to electricity infrastructure [13]. Facility-location optimisation methods that pick the best subset of sites for a fixed budget are a mature field of operations research [14].
What our research did not find is a documented model, for any Indian city, that combines demand and coverage scoring with measured distribution-transformer or feeder-level headroom, rather than a general proximity check or a qualitative capacity judgement. A commercial Indian site-selection platform maps substation locations, but substations sit upstream of the distribution transformers that actually constrain a specific street or neighbourhood, and its own documentation describes its outputs as illustrative rather than measured [15]. A 2026 academic framework demonstrates joint siting and grid-constraint optimisation using artificial intelligence, but on a representative synthetic region, not real Delhi feeder data [16]. That is a claim about the absence of a documented, deployed precedent, not a definitive claim that no one anywhere has attempted it, and it should be verified against a fuller competitive scan before Delhi Transco Limited relies on it.
The genuine contribution here is not a new algorithm. It is combining an already-published class of demand and coverage models with a real, measured grid-capacity layer, and doing so as a repeatable government tool rather than a one-off private study.
4.4 An optional forecasting layer, and why it matters more than it first appears
Everything described so far ranks sites against demand as it exists today. A charging station typically takes a year or two to plan, fund and build, which means a site chosen for today’s demand may already be behind the curve by the time it opens. Delhi’s own citywide numbers illustrate how fast that curve moves: EV charging load has grown from 24 MW to 227 MW in under a decade, a trajectory this case study’s own headline statistics already establish [3].
A genuinely predictive layer, rather than a purely descriptive one, would project each candidate zone’s demand forward using its recent growth trend, the same category of compound-growth or time-series forecasting method used in published EV-demand forecasting research, then rank sites against that projection rather than a snapshot. This is a meaningfully different question from the scoring model described above: it asks not only where demand is highest today, but where it will be highest by the time a station could realistically open.
This layer has not been built on real Delhi data in this case study, since it requires multiple years of zone-level EV registration history that would need to be assembled from Vahan’s records rather than pulled as a single citywide figure. Building the real version on actual Vahan registration history by RTO zone is a natural, low-cost extension of the Stage 1 and Stage 2 pilot described in Section 7, not a separate project.
Interactive pilot tool: Open the Delhi EV Charging Site Suitability Model demo
To make this two-stage mechanism, feasibility gate, suitability ranking, and demand forecast, something that can be seen working rather than only read about, an interactive demonstration was built alongside this case study.
Why it was built: a written description of a scoring model is harder to evaluate than watching it actually respond to different inputs. The tool lets a reader move the feasibility threshold and the demand and coverage weights and watch the ranked list of zones update live, and toggle between today’s demand and a three-year projection to see how far a purely present-day view of demand can diverge from where growth is actually heading.
What it is useful for: pressure-testing the model’s logic before committing to building it on real data, showing a non-technical audience how the feasibility gate behaves differently from a simple weighted average, and giving Delhi Transco Limited a concrete artefact to react to rather than an abstract formula.
Its limitations: the twelve zones, their demand, headroom and coverage-gap scores, and their growth rates are illustrative, constructed to reflect realistic Delhi patterns rather than measured from Vahan, the Delhi Open Database, or DISCOM feeder data. It should be treated as a working proof of mechanism, not a preview of Delhi’s actual site rankings. It also holds grid headroom constant in the three-year projection, since forecasting how a transformer’s spare capacity will change as load grows requires DISCOM load-growth data this pilot does not yet have.
5. Strategic Options
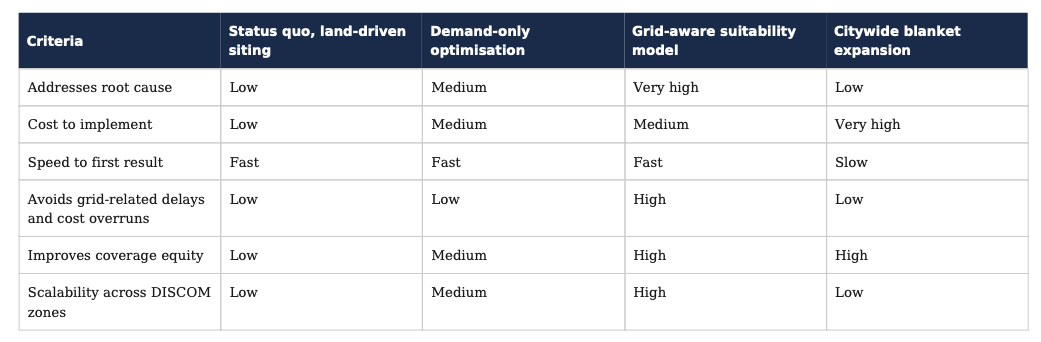
Continuing to site stations by available land is fast but leaves grid strain and coverage gaps unaddressed, as the current network already shows. Optimising for demand alone would close coverage gaps faster than today’s approach, but without a grid constraint it risks recommending sites that later face the same connection delays and cost overruns already documented in Delhi. A blanket citywide expansion without any ranking method is the most expensive option and does not target the specific charging-point shortfall efficiently. On this qualitative comparison, a grid-aware suitability model is the option most likely to combine low cost, fast implementation, and avoidance of the grid-related failures already visible in the existing network, though the ratings above reflect informed judgement rather than a quantified scoring exercise, and should be tested against real pilot outcomes.
6. The Investment Case
Building this model does not require new capital funding, it requires analyst time and access to data Delhi already holds. The genuinely capital-intensive part is the transformer-monitoring sensor layer, which is the same hardware proposed in ICG’s e-rickshaw charging case study, priced there at roughly Rs 10,000 to Rs 23,000 per monitored transformer [17]. If that sensor network is deployed for the e-rickshaw pilot, this siting model can draw on the same data at no additional hardware cost.
The value this model protects is on the cost side of station deployment. A basic charging point costs on the order of Rs 10,000 to a few lakh rupees, a small station with two to four points roughly Rs 15 to 30 lakh, and a larger DC fast-charging hub roughly Rs 1 to 3 crore [18]. Grid connectivity and transformer upgrade costs, when a site turns out to need them, can add a further Rs 5 to 15 lakh, and industry sources note these costs are frequently underestimated by 20 to 30 percent, delaying projects by two to three months [7]. A siting model that screens out low-headroom cells before land is committed avoids exactly this category of cost overrun and delay, station by station, across every future rollout phase.
PM E-DRIVE has already allocated Rs 2,000 crore nationally for public charging infrastructure, the same pool of funds referenced in ICG’s e-rickshaw case study, of which none had been disbursed for infrastructure installation as of November 2025 [19]. This model is designed to help Delhi Transco Limited make better use of that allocation as it is drawn down, not to request new funding.
A worked sensitivity model. Building the model itself costs little, largely analyst time and data acquisition rather than new capital, but the value it protects should be quantified at the scale Delhi Transco Limited would actually deploy it, not just illustrated with a single small example. The table below models the net avoided cost across a downside, base and upside scenario, varying the number of candidate sites screened, the share that would trigger an unexpected upgrade, the average upgrade cost, and the share of those upgrades that can actually be avoided by selecting an alternative feasible site rather than simply absorbing the cost.

Two things follow from this. First, even in the downside scenario, where fewer sites are screened, upgrades are rarer, and only a quarter of avoidable cases are actually avoided, the model still returns a meaningfully positive net benefit against its own modest operating cost. Second, the model’s value scales with how many sites Delhi actually runs through it, which is itself a reason to make it a standard screening step across the full PM E-DRIVE rollout rather than a one-off pilot exercise.
It is also important to be precise about what “avoided cost” means here. The model does not make a genuine grid constraint disappear. If a high-demand location genuinely requires a transformer upgrade to serve the population that needs it, the correct response may be to fund that upgrade, not to avoid the site. The real value created falls into three related but distinct categories: identifying infeasible sites before land and planning effort are committed to them, enabling a switch to an already-feasible alternative site when one exists nearby, and, where no such alternative exists, giving Delhi Transco Limited advance notice that a specific site needs a grid upgrade funded and scheduled before construction, rather than discovering that mid-project. The sensitivity table above quantifies the second category, since that is the case where a cost is genuinely avoided rather than simply anticipated earlier.
This sensitivity model uses real, sourced unit costs for the upgrade-cost range, but the number of sites screened, the upgrade incidence rate, the avoidable share, and the model’s own operating cost are illustrative planning assumptions across a plausible range, not a measured result. It is presented as a template Delhi Transco Limited can re-run once real candidate-site and transformer data are available.
7. Implementation Roadmap
Months 0 to 3, Map and Diagnose. Assemble the demand and coverage layers from Vahan and the Delhi Open Database for one DISCOM zone, and gather whatever feeder or transformer capacity data is already available for that zone, from State Load Despatch Centre feeds or direct DISCOM data sharing.
Months 3 to 9, Pilot. Run the suitability model on that single zone, rank all candidate sites, and compare the ranking against the zone’s existing charging stations to see how many currently sit in low-suitability cells and how many high-suitability cells remain unserved. Use this comparison to validate or recalibrate the model’s weights.
Months 9 to 18, Refine and Expand. Extend the model to additional DISCOM zones, incorporating any transformer-monitoring data that becomes available through the parallel e-rickshaw charging pilot, and use it to screen candidate sites for Delhi’s next PM E-DRIVE-funded rollout phase.
Months 18 onward, Scale and Standardise. Package the model as the standard site-screening step Delhi Transco Limited applies before any future public charging station is approved, and share the approach with other states planning their own PM E-DRIVE-funded rollouts.
8. What Government Needs to Do, and Who Needs to Do It
This model is designed to work inside the institutional structure Delhi has already put in place, not to require a new one.
Delhi Transco Limited, already designated the single nodal agency for charging infrastructure planning and grid integration under the city’s EV Policy 2.0, is the natural body to own and apply this model. Whether it can make the model a mandatory screening step unilaterally, or whether that requires sign-off from DERC or another regulatory authority, is a governance question this case study has not verified and that should be confirmed before the recommendation is presented as a simple administrative decision. At minimum, Delhi Transco Limited can begin using the model as a required input to its own site recommendations, which does not depend on resolving that broader question.
Delhi’s DISCOMs should share feeder and, where available, transformer-level load data with Delhi Transco Limited for this purpose, extending the same data-sharing relationship already proposed for the e-rickshaw charging pilot in ICG’s companion case study. Whether DISCOMs are formally obligated to share this data or would do so voluntarily is a separate question worth confirming early.
The State EV Nodal Agency should apply the model’s output when preparing Delhi’s site proposals for PM E-DRIVE funding rounds. This case study assumes that doing so is compatible with PM E-DRIVE’s existing site-selection guidelines, since the scheme already asks nodal agencies to weigh power supply and grid readiness among its other criteria, but it has not confirmed with the scheme’s administrators whether a state-specific screening tool of this kind can be formally incorporated into the funding process rather than simply informing which sites a state chooses to submit.
Suggested timeline. A pilot covering one DISCOM zone can be built and validated within two quarters using data Delhi already holds, well within a single budget cycle, and in time to inform the site selection for Delhi’s next PM E-DRIVE-funded rollout phase.
9. Final Recommendation
The recommendation is not to build more charging stations faster. It is to change the method by which Delhi decides where the next station goes, from a process driven by available land to one driven by measured demand, measured coverage gaps, and measured grid capacity.
The constraint on Delhi’s charging network has never really been ambition or funding. It is the absence of a repeatable method for weighing demand, coverage and grid capacity together before a site is chosen, rather than discovering a grid problem after construction has begun. Adopting this model could meaningfully reduce the connection delays and cost overruns already documented in Delhi’s rollout, close coverage gaps in the underserved areas the current network has left behind, and give every other Indian city planning its own PM E-DRIVE rollout a tested method to follow.
Sources and Methodology
Numbers in brackets in the text above correspond to the sources below.
1. Delhi’s charging point shortfall (roughly 8,800 to 10,000 installed against a stated requirement of 36,150): IMARC Engineering analysis of Delhi EV Policy 2026 and charging infrastructure investment trends.
2. The 84 percent non-functional charger finding: Institute for Energy Economics and Financial Analysis (IEEFA), “Upgrading India’s Public EV Charging Experience,” briefing note, August/September 2024, based on a representative sample survey across South, Central, West and East Delhi.
3. Delhi’s EV charging load growth (24 MW to 227 MW, projected 375 MW) and its 40.11 percent share of national EV charging electricity consumption: IMARC Engineering, Delhi EV Policy 2026 analysis.
4. The 2021 charging rollout’s land-allocation method and the 70 percent Delhi Metro parking share: OECD Observatory of Public Sector Innovation case writeup on Delhi’s EV charging infrastructure model, citing the Dialogue and Development Commission of Delhi.
5. PM E-DRIVE site-selection criteria for public charging infrastructure: Ministry of Heavy Industries, draft and operational guidelines for EV public charging stations under PM E-DRIVE, 2025.
6. Geographic concentration of Delhi’s charging demand in South and Central Delhi versus outer districts: Down To Earth reporting on Delhi’s EV charging access gaps.
7. Grid connection delays, cost overruns, and the need to independently verify feeder-level headroom: BusinessLine and Policy Circle analysis of Delhi’s EV charging infrastructure challenges, 2026.
8. Delhi EV Policy 2.0 targets and Delhi Transco Limited’s designation as single nodal agency: Policy Circle and Deccan Herald reporting on Delhi’s draft EV policy, 2026.
9. Vahan vehicle registration data as a demand proxy: Ministry of Road Transport and Highways Vahan dashboard, via the Transport Data Consortium portal.
10. Delhi State Load Despatch Centre real-time feeder loading data: delhisldc.org, DISCOM loadings dashboard.
11. Delhi Open Database of EV charging and swapping stations: Government of NCT of Delhi, ev.delhi.gov.in, a mandated real-time reporting database for all charging operators in the city.
12. The 500-metre grid-cell resolution for Delhi siting studies: an academic set-covering and GIS coverage study for EV charging infrastructure siting in NCT Delhi using mixed traffic origin-destination data.
13. GIS multi-criteria siting frameworks including electricity-infrastructure proximity as a weighted criterion: Infosys and Esri India, “Optimal Siting of Charging Infrastructure for EV Ecosystem,” ArcIndia News, Volume 18, March 2024.
14. Facility-location optimisation methods (p-median, set-covering, maximal covering location problem) for charging-station siting: comparative operations-research literature, including Tian et al., 2018, published in Simulation.
15. A commercial Indian site-selection platform’s substation-level grid-readiness scoring and its own stated illustrative-not-measured disclaimer: RangeNow Sitelead, Nonillion Product Labs.
16. A 2026 AI-based joint siting and grid-optimisation framework demonstrated on a synthetic representative region rather than real Delhi data: Kavya et al., Scientific Reports, 2026.
17. Transformer capacity monitoring device costs: as sourced in ICG’s companion case study on e-rickshaw charging, drawn from current Indian retail listings and the REC Limited RDSS guidance note.
18. Charging station capital cost benchmarks (basic point through large DC fast-charging hub): EVSelect.in, “How to Set Up an EV Charging Station in India,” 2026 cost and steps guide.
19. PM E-DRIVE public charging infrastructure allocation and disbursement status: as sourced in ICG’s companion e-rickshaw charging case study, drawn from government replies in the Lok Sabha and official scheme documentation.