Urban Development Planning
Tata Steel: From CSR Spending to Measurable Livelihood Impact
September 28, 2026

Decision question
How can Tata Steel use data-driven geographic targeting to strengthen livelihood outcomes for vulnerable communities in Jharkhand and Odisha?
Proposed decision
Deploying an additional ₹100 crore over three years
1. Executive Summary
Tata Steel has a large and established CSR ecosystem, primarily implemented through the Tata Steel Foundation (TSF). Its recent reporting shows both substantial CSR expenditure and expansion in the number of people reached.
Tata Steel reported CSR expenditure of approximately ₹580 crore in FY24, ₹585 crore in FY25 and ₹473 crore in FY26, while reported lives impacted increased from 4.4 million in FY24 to 5.77 million in FY25 and 6.94 million in FY26.
The data suggests that the next opportunity is not simply more CSR spending, but more precise geographic and outcome-based allocation.
The district-level analysis in this case combines four indicators:
CSR intensity
Multidimensional livelihood vulnerability
Women's vulnerability
Agricultural dependence
The analysis identifies West Singhbhum, Gumla and Keonjhar as districts with particularly strong combinations of livelihood and agricultural vulnerability, while the CSR data shows substantially different levels of reported investment across districts.
The proposed Tata Livelihood Resilience Accelerator
The proposed accelerator would concentrate additional funding around three connected pathways:
Youth → Skill → Employment → Income
Women → SHG → Enterprise → Market → Income
Farmers → Productivity → Diversification → Market → Income
The key shift is from measuring how many people were reached or trained, to measuring whether household income, employment and economic resilience actually improved.
2. Tata Steel's CSR Footprint
Tata Steel's CSR activities cover multiple states and a broad range of social-development themes. Its FY25 reporting shows 5.77 million lives impacted through CSR, with activities spanning education, public health, livelihoods, agriculture, skill development, gender and community enterprises, drinking water, rural infrastructure, tribal identity, disability, grassroots governance and environment.
FY25 reported beneficiary distribution
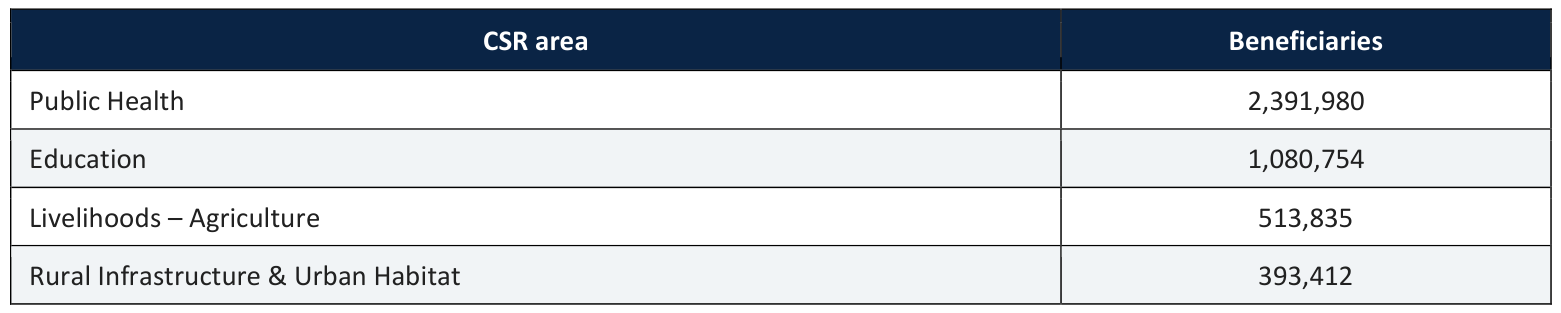
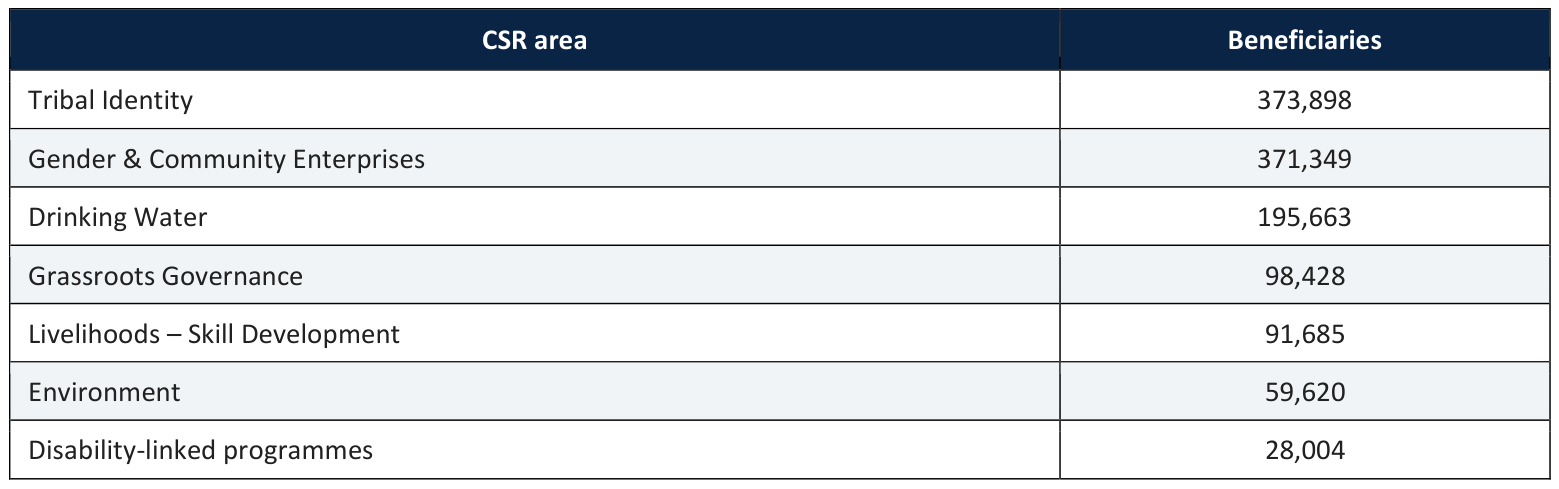
Table 1. FY25 CSR beneficiary distribution by area. Categories can overlap and are not unique individuals.
3. CSR Spending Trend

Table 2. CSR expenditure vs. lives impacted, FY24–FY26.
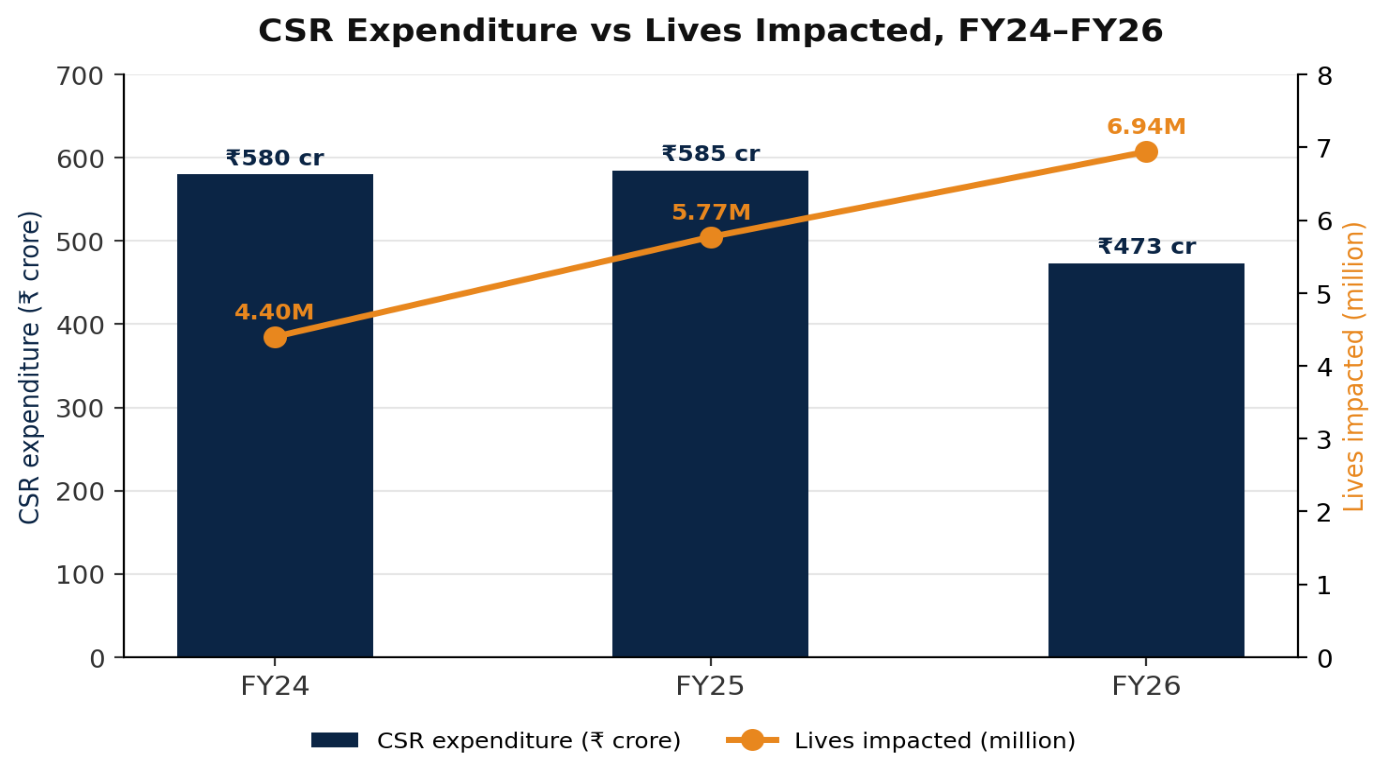
Figure 1. CSR expenditure vs. lives impacted, FY24–FY26.
What this tells us
The relationship between spending and reach is not linear. FY26 reports lower CSR expenditure than FY25 but higher reported lives impacted.
Can Tata Steel generate greater livelihood impact not simply by increasing expenditure, but by improving where and how resources are deployed?
4. Existing Geographic Concentration
Tata Steel's statutory reports provide a consistent three-year disclosure for aspirational districts.
Reported CSR spending — ₹ crore
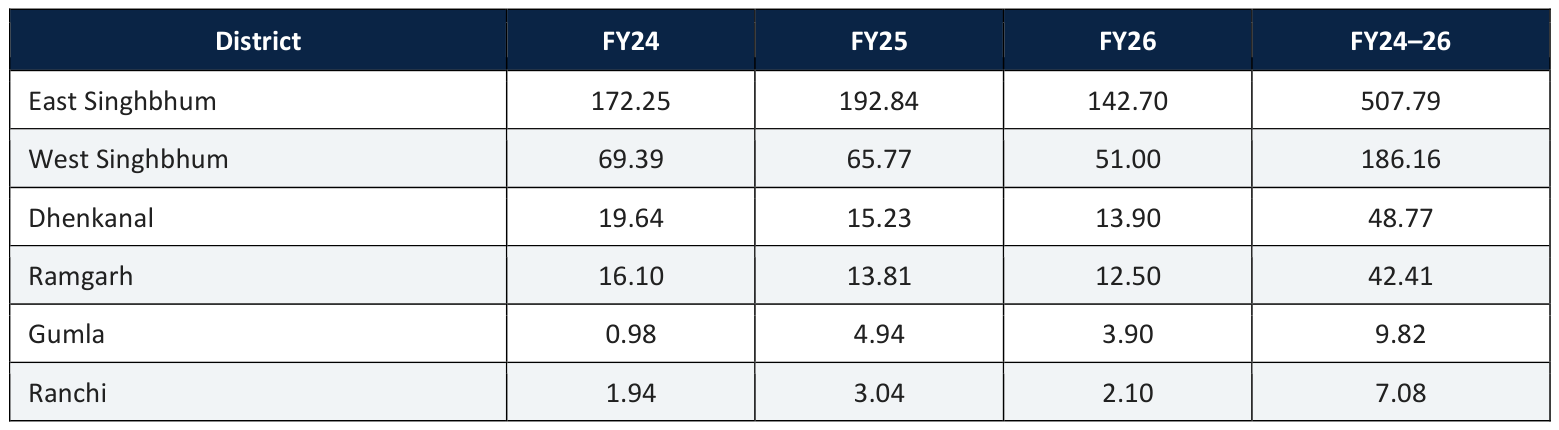
Table 3. Reported aspirational-district CSR spending, FY24–FY26 (₹ crore). Total ≈ ₹802 crore.

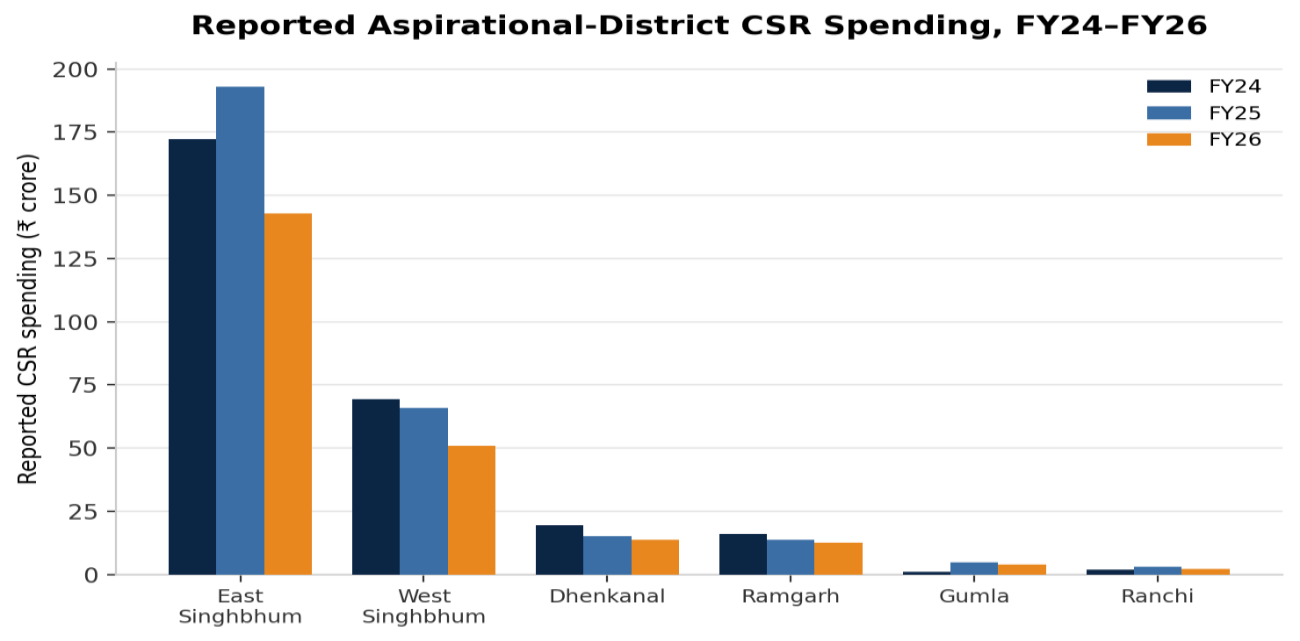
Figure 2. Reported aspirational-district CSR spending by district, FY24–FY26.
Critical caveat
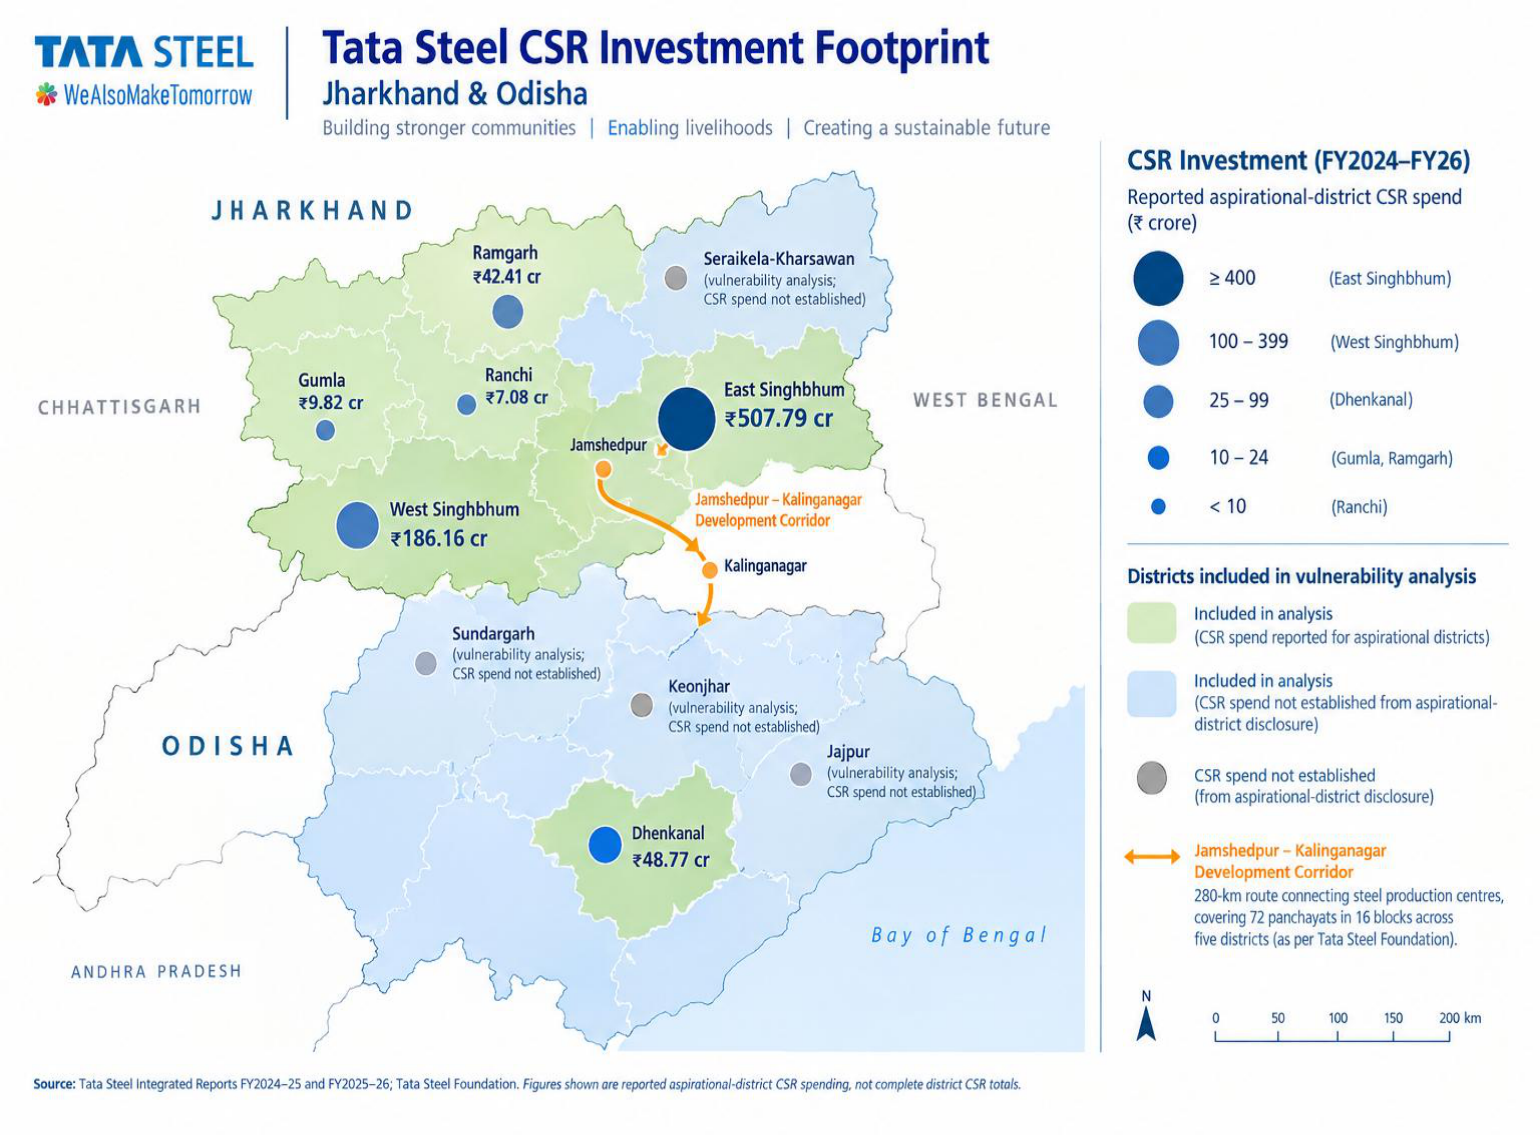
This is not Tata Steel's complete district-level CSR spending — it is the spending disclosed for aspirational districts. Keonjhar, Jajpur, Sundargarh and Seraikela-Kharsawan not appearing in this table does not mean Tata Steel spent zero there.
5. Where Is Livelihood Vulnerability Highest?
We use the NITI Aayog Multidimensional Poverty Index (NFHS-5) as the broad livelihood-vulnerability proxy.
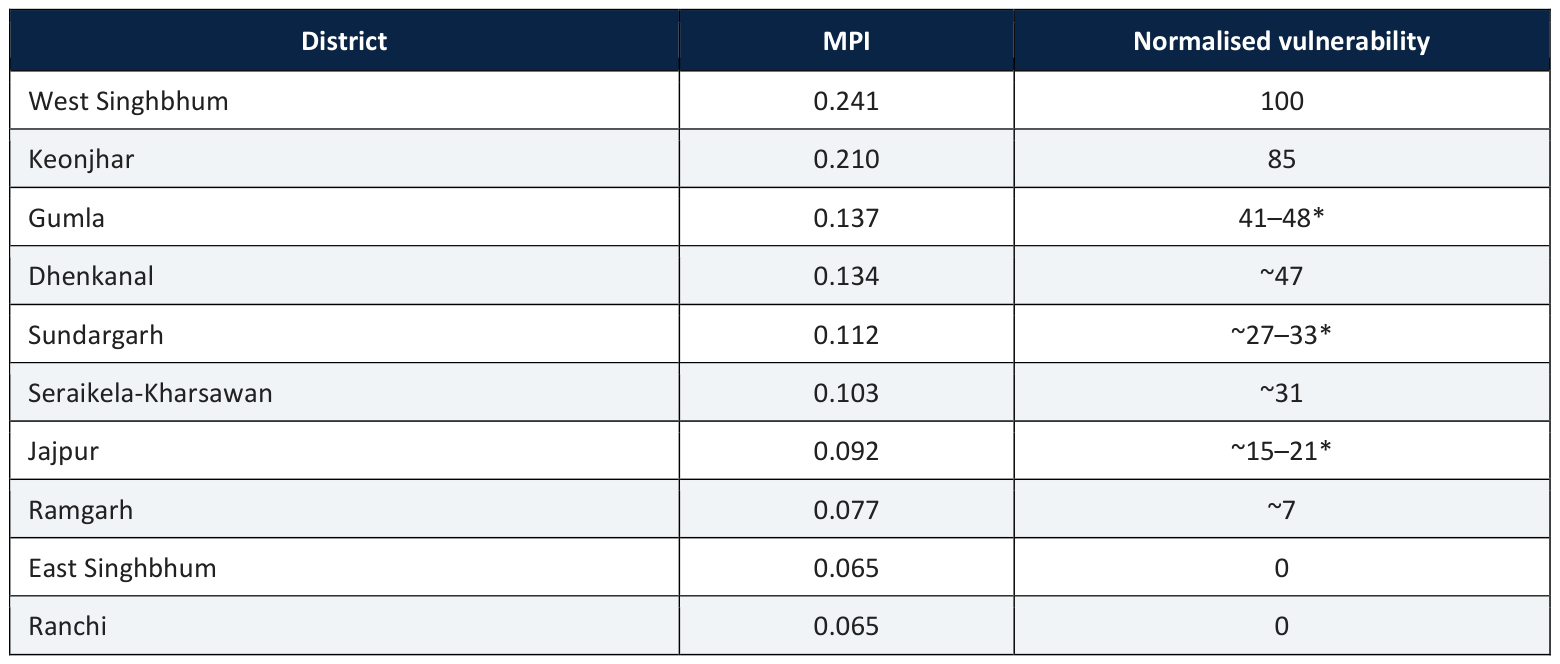
Table 4. NITI Aayog MPI by district. *Normalised score is an analytical construct; use the raw MPI in the final report.
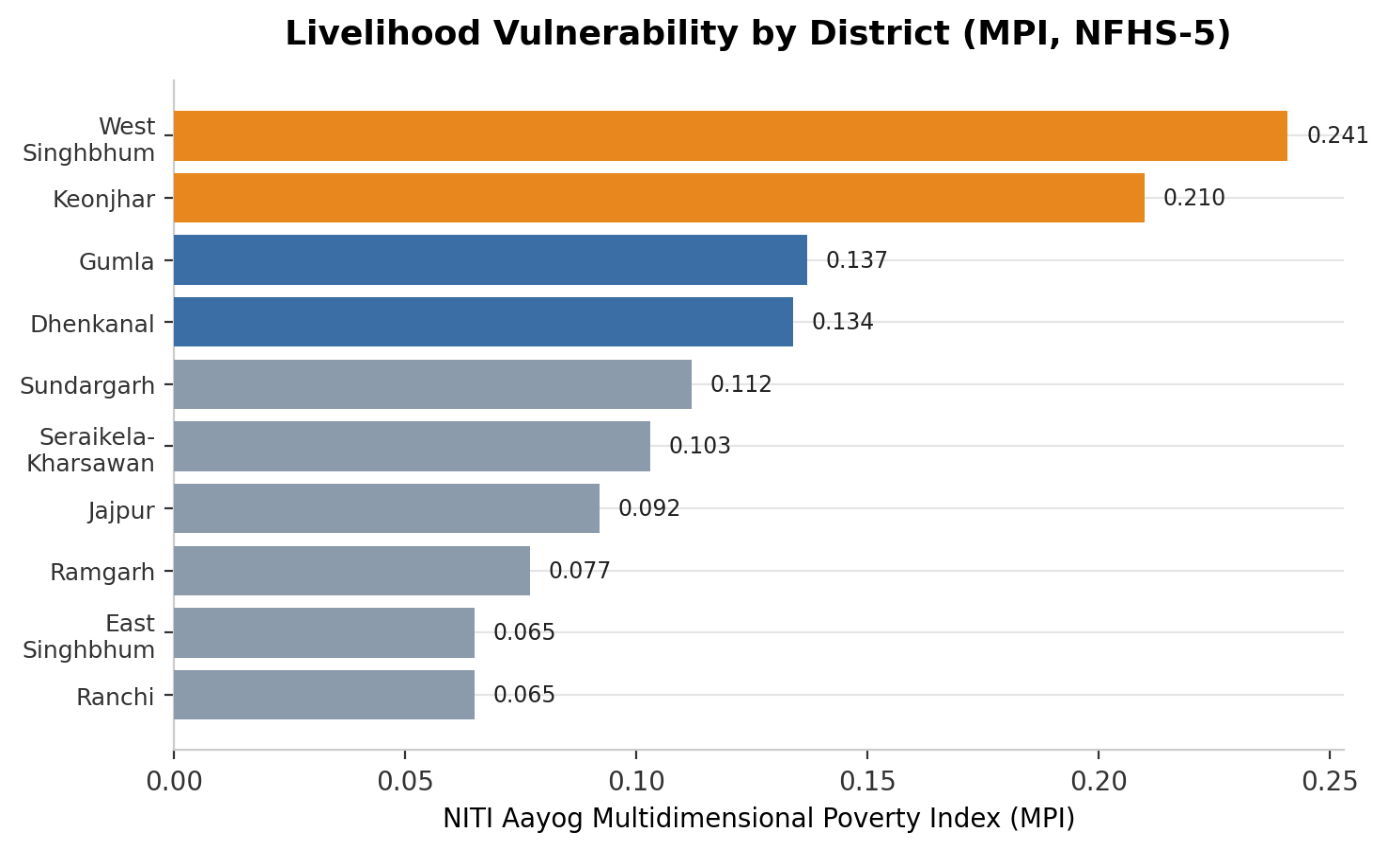
Figure 3. Livelihood vulnerability by district (MPI, NFHS-5).
West Singhbhum and Keonjhar stand out for high multidimensional vulnerability.
6. Women's Vulnerability
For a simple comparable indicator, we use female literacy deprivation = 100 − female literacy rate, using Census 2011 female literacy data.
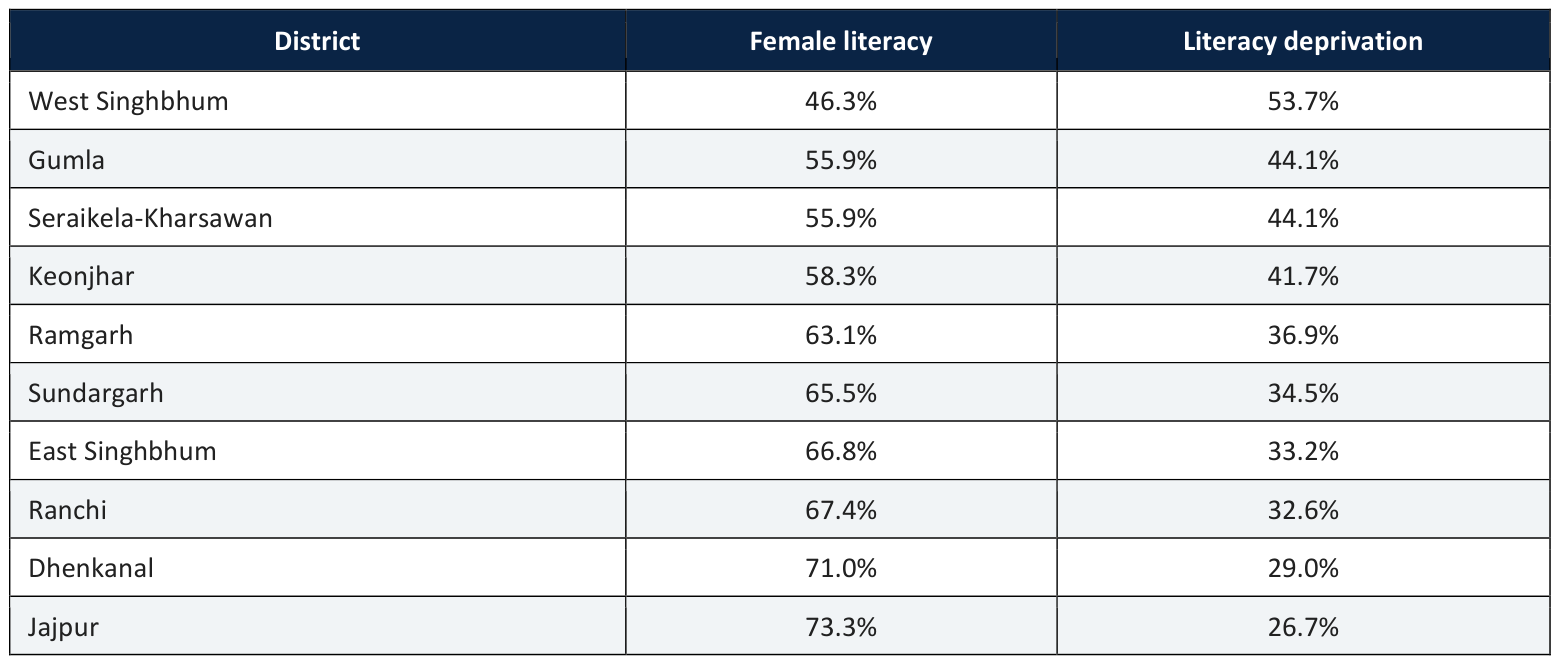
Table 5. Female literacy and literacy deprivation by district (Census 2011).
Finding
The largest female-literacy deprivation appears in West Singhbhum → Gumla/Seraikela-Kharsawan → Keonjhar.
This supports making women's economic participation a specific pillar rather than treating gender as a cross-cutting footnote.
7. Agricultural Vulnerability
Here we use agricultural-worker share = (Cultivators + Agricultural Labourers) ÷ Total Workers, which captures the structural dependence of livelihoods on agriculture.
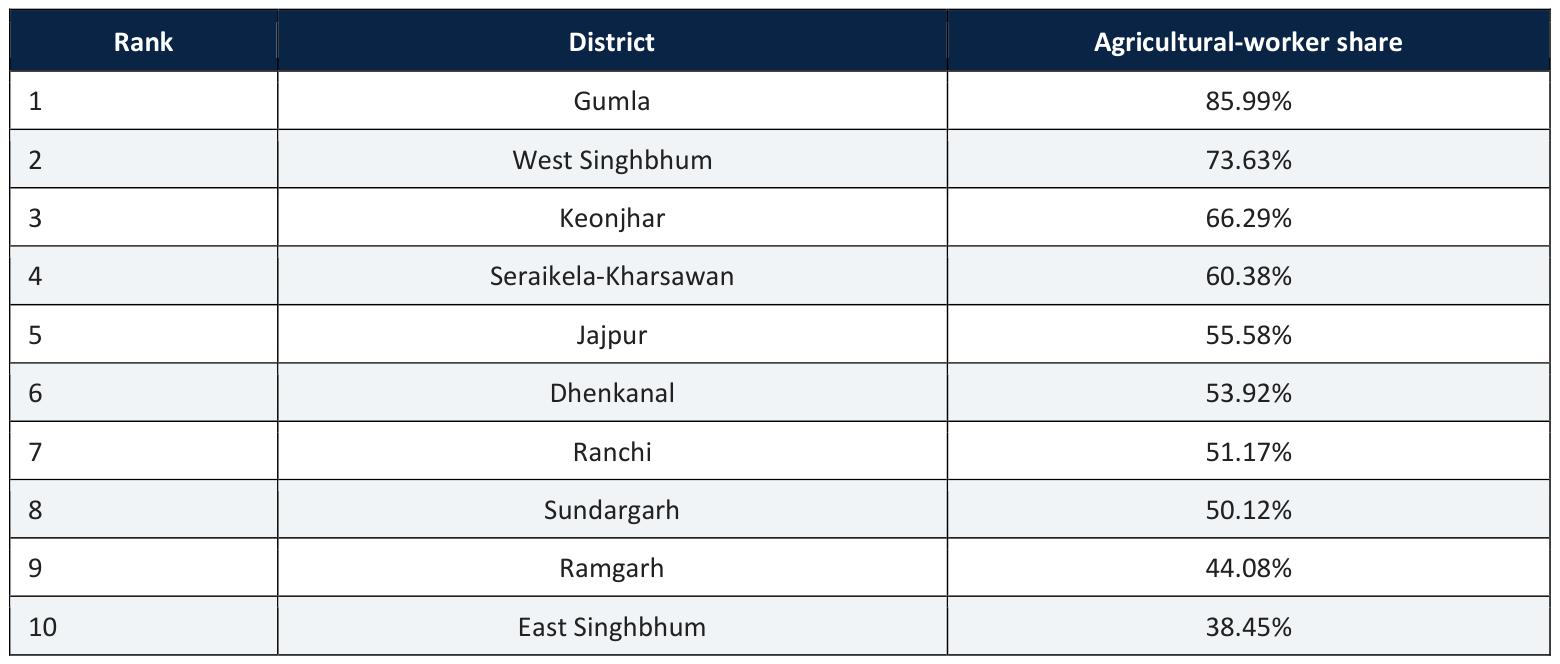
Table 6. Agricultural-worker share by district, ranked.
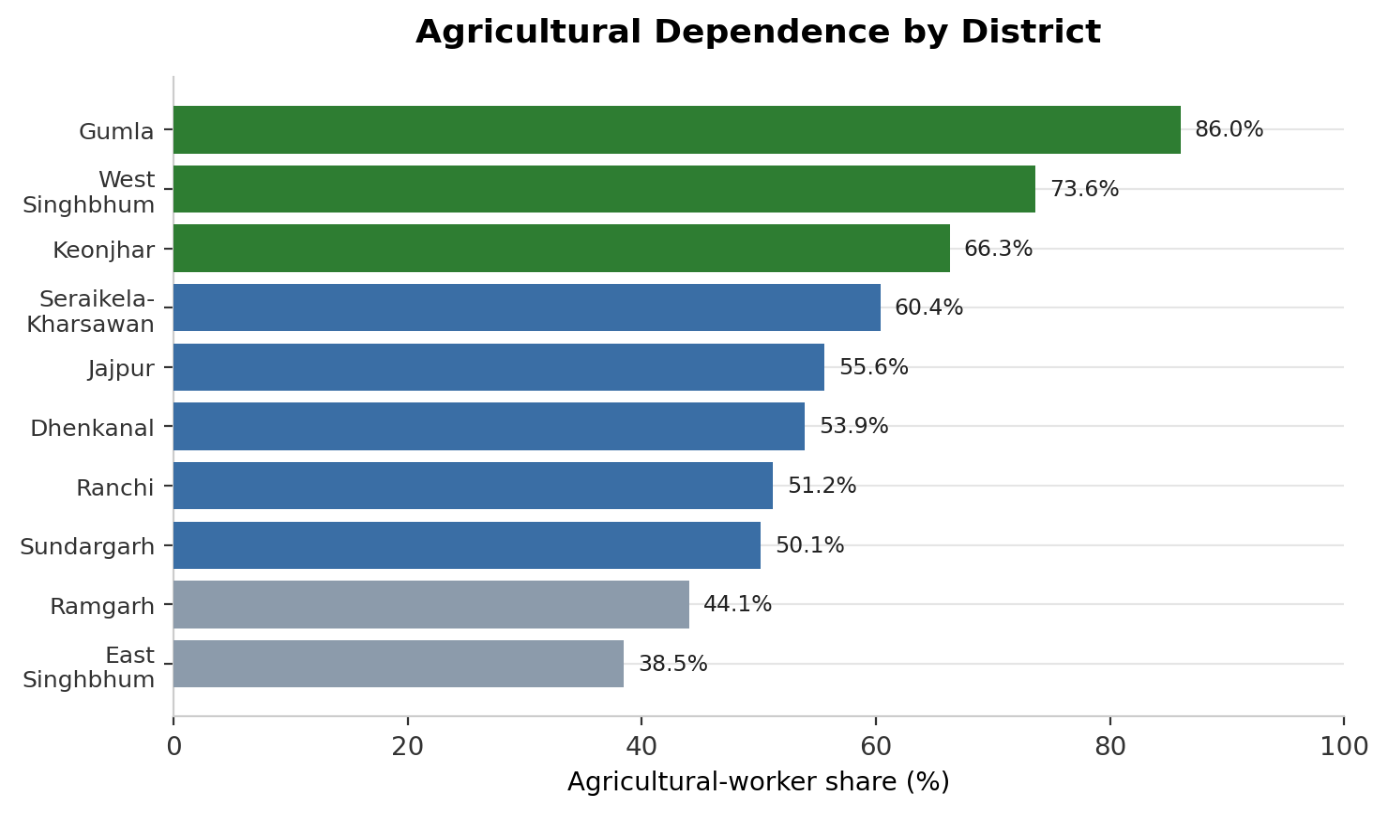
Figure 4. Agricultural dependence by district.
Gumla → West Singhbhum → Keonjhar combine high agricultural dependence with substantial broader livelihood vulnerability — strong candidates for farm-income resilience, diversification and market linkage.
8. The Hero Exhibit: Need vs CSR
This is the main analytical chart of the case. It plots CSR intensity (3-year reported Tata Steel CSR spend ÷ 2011 population) on the X-axis against livelihood vulnerability (NITI Aayog MPI) on the Y-axis, with bubble size representing agricultural-worker share and bubble colour representing women's vulnerability.
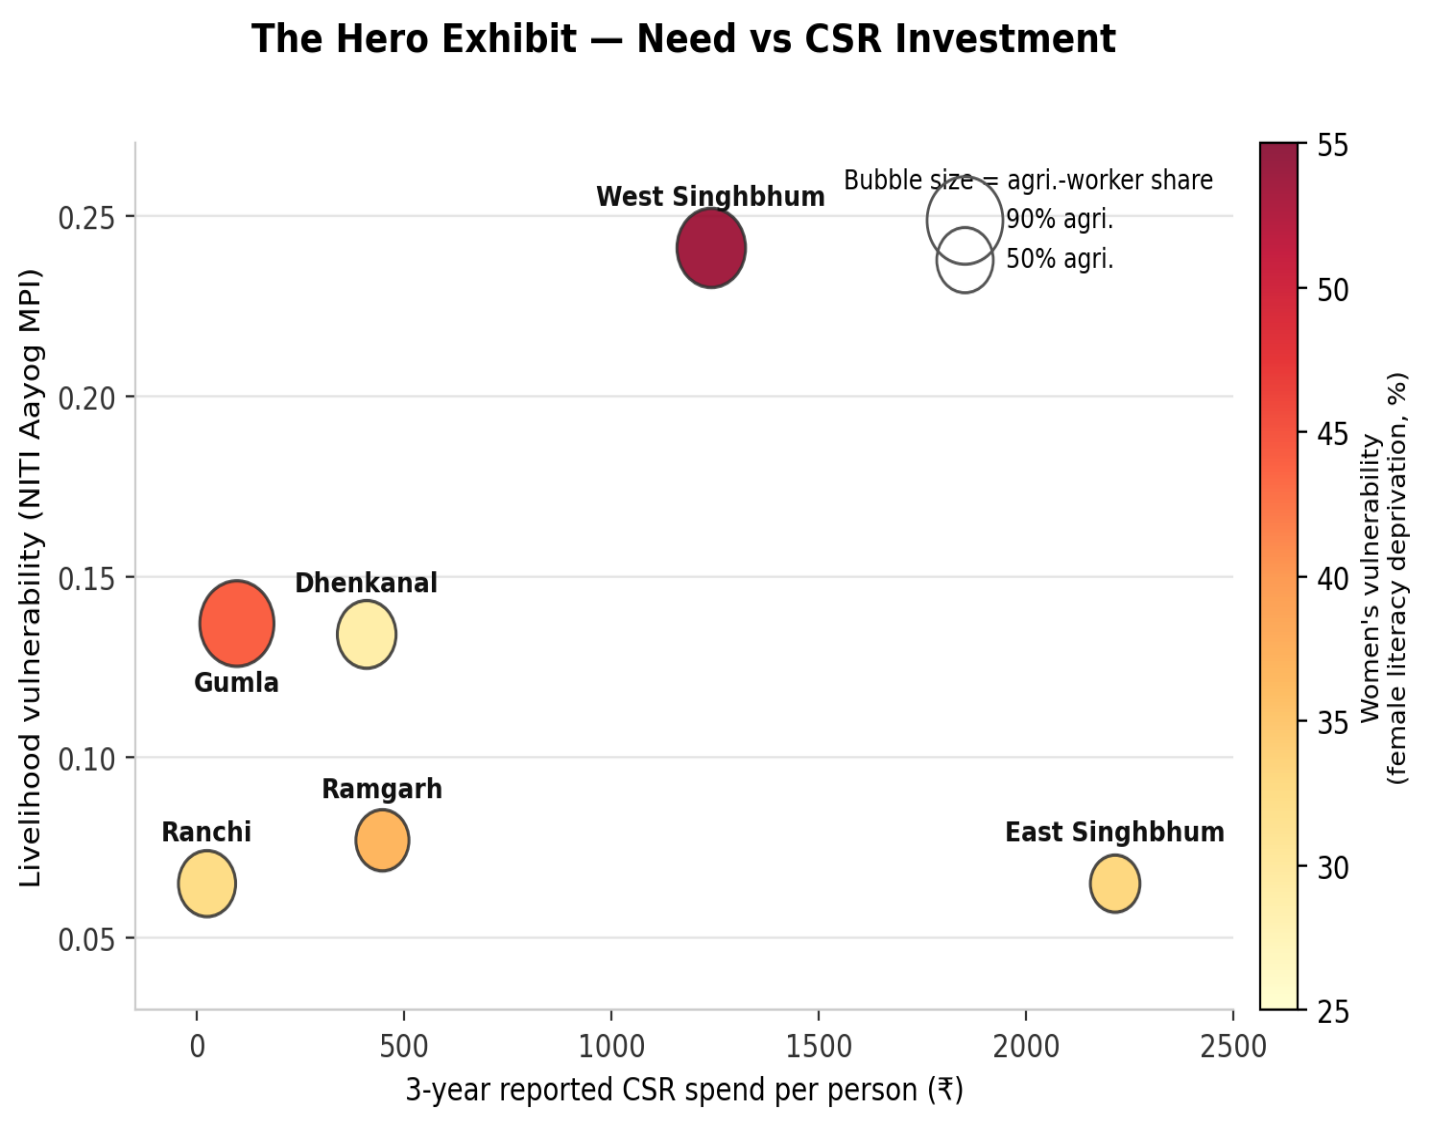
Figure 5. The Hero Exhibit — need vs. CSR investment, by district.
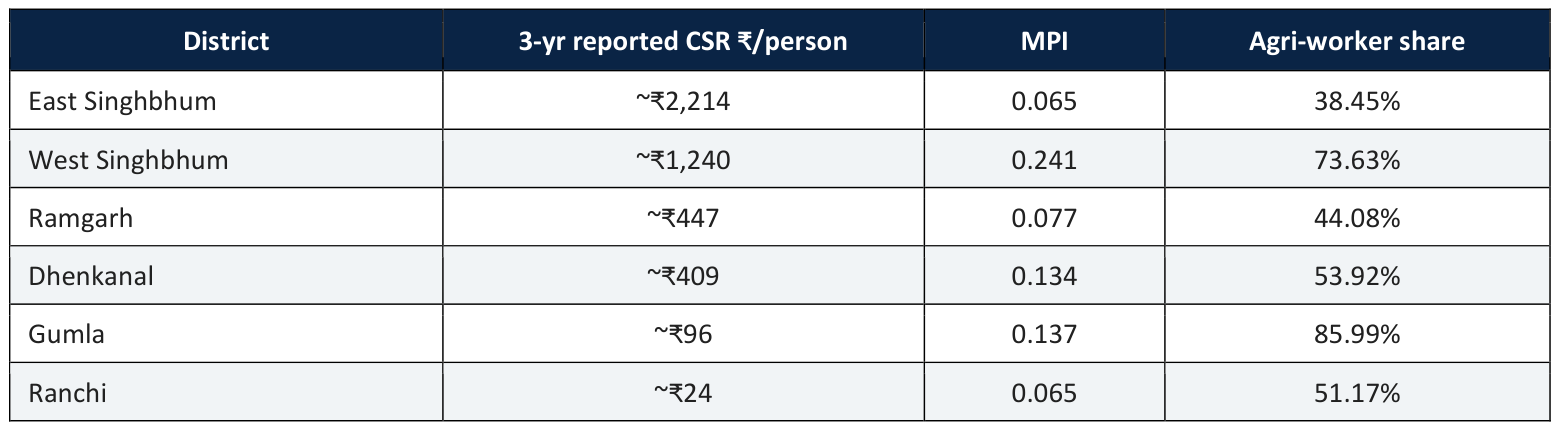
Table 7. Hero exhibit data — CSR intensity, MPI, and agricultural dependence for the six comparable districts.
The analytical story
This does not mean “Tata Steel spends too much in East Singhbhum.” Instead, the more defensible question is:
Are future marginal CSR investments being directed toward the districts and livelihood groups where additional spending can address the largest measurable gaps?
9. Diagnosis
The analysis points toward three different situations.
A. High vulnerability + high existing CSR — West Singhbhum
The issue may not be lack of CSR presence. The question becomes: how can existing programmes generate deeper livelihood outcomes?
B. High vulnerability + relatively low comparable reported CSR — Gumla
Gumla combines MPI = 0.137, female-literacy deprivation = 44.1%, agricultural-worker share = 85.99%, and reported aspirational-district CSR spending over FY24–26 of only ₹9.82 crore.
This creates a strong candidate for targeted livelihood investment, subject to verification using complete MCA CSR records.
C. High vulnerability + incomplete CSR disclosure — Keonjhar
Keonjhar has MPI = 0.210, female literacy = 58.3%, and agricultural-worker share = 66.29%. But we cannot infer its total Tata Steel CSR spending from the aspirational-district table.
Keonjhar should be treated as a high-need district requiring further CSR-spend verification, not as an under-funded district.
10. Proposed Solution — Tata Livelihood Resilience Accelerator
A three-pillar model:
1. Skill-to-Job
Labour-market assessment → targeted training → certification → employer linkage → apprenticeship → placement → retention.
Instead of “10,000 youth trained,” measure “% placed + median income + 6/12-month retention.”
2. Women-to-Enterprise
SHG → business training → finance → product development → market linkage → digital payments → institutional buyers.
Measure:
Women with independent income
Enterprise survival after 12 months
Average enterprise revenue
Household income change
Market-linked enterprises
This fits well with Tata Steel's existing Gender & Community Enterprises work.
3. Farm-to-Income
Productivity → diversification → aggregation → value addition → market access → higher household income.
Possible interventions:
Climate-resilient agriculture
Irrigation / water-efficient technologies
Protected cultivation
Livestock / fisheries
FPO / producer collectives
Market linkage and value addition
Government-scheme convergence
The emphasis should be income, not simply agricultural adoption.
11. Illustrative ₹100 Crore Allocation
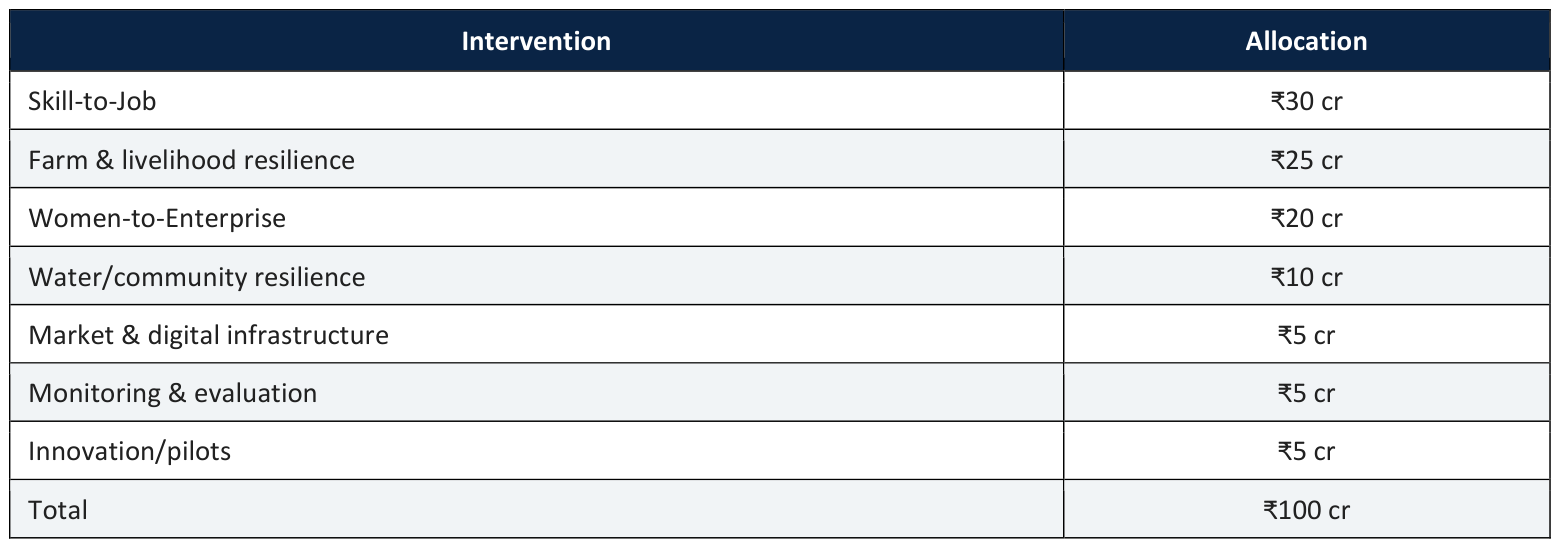
Table 8. Illustrative ₹100 crore allocation across intervention pillars.
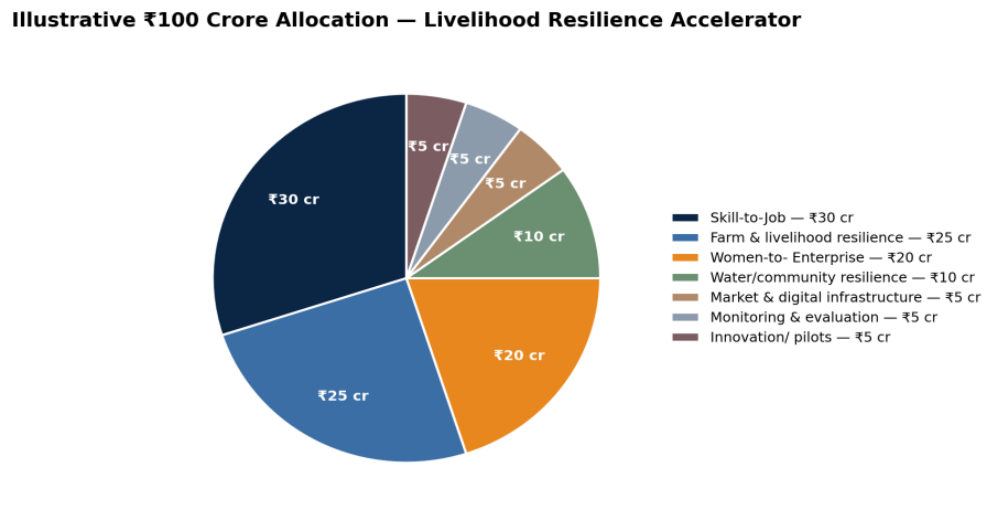
Figure 6. Illustrative ₹100 crore allocation by intervention.
These are illustrative allocations, not a claim that this is Tata Steel's required budget. The actual allocation should follow the district-level need analysis.
12. Outcome Framework
This is where the case reads more like a consulting business case than a CSR report.
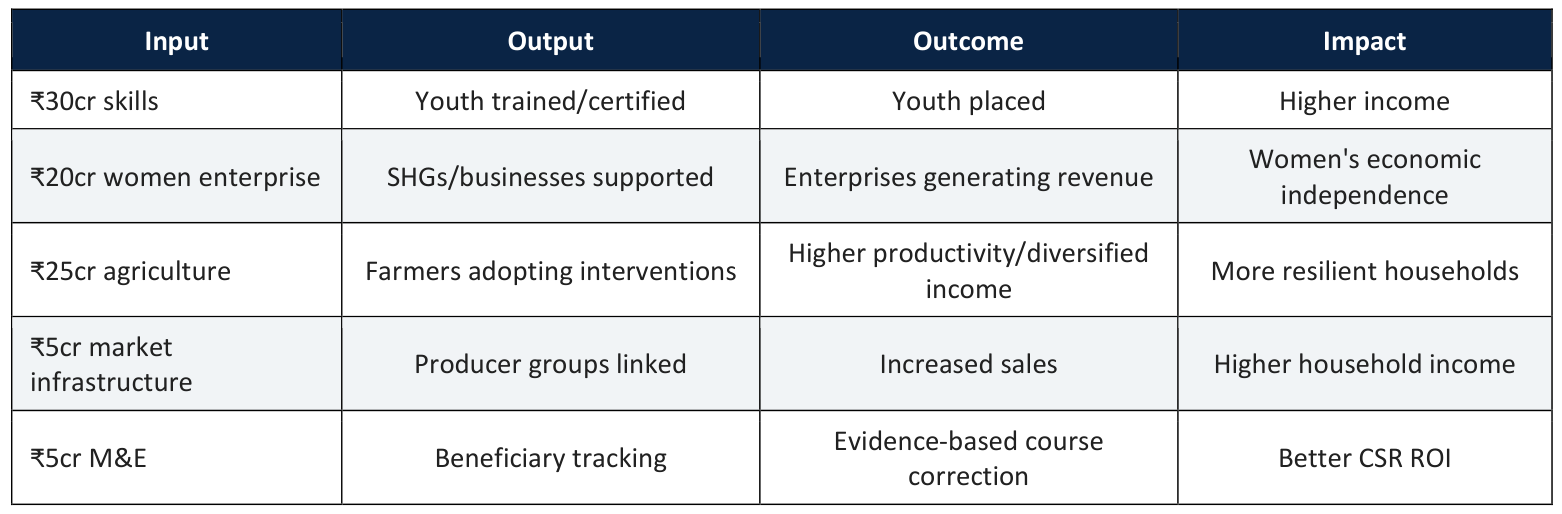
Table 9. Input–output–outcome–impact logic model.
Core KPI
Instead of cost per person reached, introduce cost per sustained livelihood created:
Total programme expenditure ÷ beneficiaries who achieve a defined income/employment outcome and retain it for 12 months.
13. Impact Dashboard
The proposed GIS-based dashboard could work as a chain:
District → Vulnerability → Existing CSR → Programme → Beneficiary → Outcome → Income/employment impact
A dashboard could allow Tata Steel to identify:
High-vulnerability villages
Current programme coverage
Beneficiary groups
CSR expenditure
Training participation
Employment outcomes
Women's enterprise performance
Farmer income changes
14. Final Recommendation
The case should not conclude that Tata Steel needs to simply “increase CSR spending in under-served districts.”
Tata Steel has already built substantial CSR scale. The next opportunity is to make this scale more geographically precise and outcome-driven.
The analysis suggests that districts such as West Singhbhum, Gumla and Keonjhar warrant closer attention because of their combination of multidimensional livelihood vulnerability, women's vulnerability and agricultural dependence.
The proposed ₹100-crore Livelihood Resilience Accelerator would therefore use a district-level targeting model, linking CSR allocation to measurable employment, enterprise and farm-income outcomes.
The strategic shift
From: CSR spending → beneficiaries reached
To: Need → targeted investment → livelihood outcome → measurable income impact
15. References
Tata Steel — Integrated Report & Annual Accounts 2025–26 Used for FY26 CSR expenditure, lives impacted, CSR footprint and aspirational-district CSR spending. https://www.tatasteel.com/investors/integrated-report-2025-26/index.html
Tata Steel — Integrated Report & Annual Accounts 2024–25 Used for FY25 CSR expenditure, CSR beneficiaries, CSR themes and district-level aspirational-district spending. https://www.tatasteel.com/investors/integrated-reportannual-report/118-integrated-annual-report-2024-25
Tata Steel — Integrated Report & Annual Accounts 2023–24 Used for FY24 CSR spending, district-level CSR disclosures and historical CSR footprint. https://www.tatasteel.com/investors/integrated-reportannual-report/integrated-report-annual-accounts-2023-24-117th-year-and-related-documents
Tata Steel — Business Responsibility & Sustainability Reports (BRSR) Used particularly for the aspirational-district CSR expenditure tables and CSR beneficiary information. https://www.tatasteel.com/investors/integrated-reportannual-report
Tata Steel Foundation — CSR / Foundation Overview Used to establish Tata Steel Foundation's geographical footprint, programmes and development-corridor approach. https://www.tatasteel.com/corporate/our-organisation/csr/tata-steel-foundation
Tata Steel Foundation — Annual Report Used for information on the Jamshedpur–Kalinganagar Development Corridor and its geographic coverage. https://www.tatasteel.com/media/17240/tatasteelfoundation-annualreport_compressed-1.pdf
Tata Steel — Corporate CSR Page Used for current CSR programme areas and Tata Steel's CSR framework. https://www.tatasteel.com/corporate/our-organisation/csr NITI Aayog — National Multidimensional Poverty Index 2023: A Progress Review Used for district-level multidimensional poverty/vulnerability indicators for Jharkhand and Odisha. https://www.niti.gov.in/sites/default/files/2023-07/National-Multidimentional-Poverty-Index-2023-Final-17th-July.pdf
NITI Aayog — Odisha Multidimensional Poverty Index / District Data Used for MPI values for districts including Keonjhar, Dhenkanal, Sundargarh and Jajpur. https://www.niti.gov.in/sites/default/files/2023-07/National-Multidimentional-Poverty-Index-2023-Final-17th-July.pdf
Census of India 2011 — Primary Census Abstract / Worker Data Used for district-level total workers, cultivators and agricultural labourers. https://censusindia.gov.in/nada/index.php/catalog/42551/study-description
Census of India — Odisha District Census Data Used for worker data for Keonjhar, Dhenkanal, Jajpur and Sundargarh. https://censusindia.gov.in/nada/index.php/catalog/42551/study-description
Ministry of Corporate Affairs (MCA) — CSR Data Portal Used to verify the availability and structure of company/state/district/project-level CSR data. Important limitation: the publicly available MCA district-level dataset was available through FY2024–25, not FY2025–26, so FY26 figures were taken from Tata Steel's own report rather than labelled as MCA data.