Agriculture & Rural Livelihoods
India's Vanilla Opportunity: Can Small Farmers Build a Profitable Premium Spice Value Chain?
October 12, 2026


Executive Summary
Vanilla is one of the world's highest-value spices, but its production is unusually labour-intensive. Unlike most commercial crops, it needs manual pollination, careful harvesting and several months of curing before it becomes a high-value product.
World production in 2024 was approximately 7,115 tonnes. Madagascar produced about 43%, Indonesia 21%, Mexico 7.2% and Papua New Guinea 6.9%; the top five producers accounted for roughly 85%. India is a very small producer: government horticulture statistics for 2024–25 show about 29 tonnes, of which Kerala contributed 20 t, Karnataka 6 t and Tamil Nadu 3 t.
Core question. Can India build a competitive vanilla industry not by competing with Madagascar on volume, but by improving farmer aggregation, skilled pollination, curing, quality control, traceability and premium market access?
The analysis suggests the opportunity is less about expanding acreage and more about building the missing value-chain infrastructure around existing and potential growers. A cluster model combining FPOs, pollination services, common curing centres, quality testing and premium buyers could let India capture more value from a small production base.
Headline recommendations
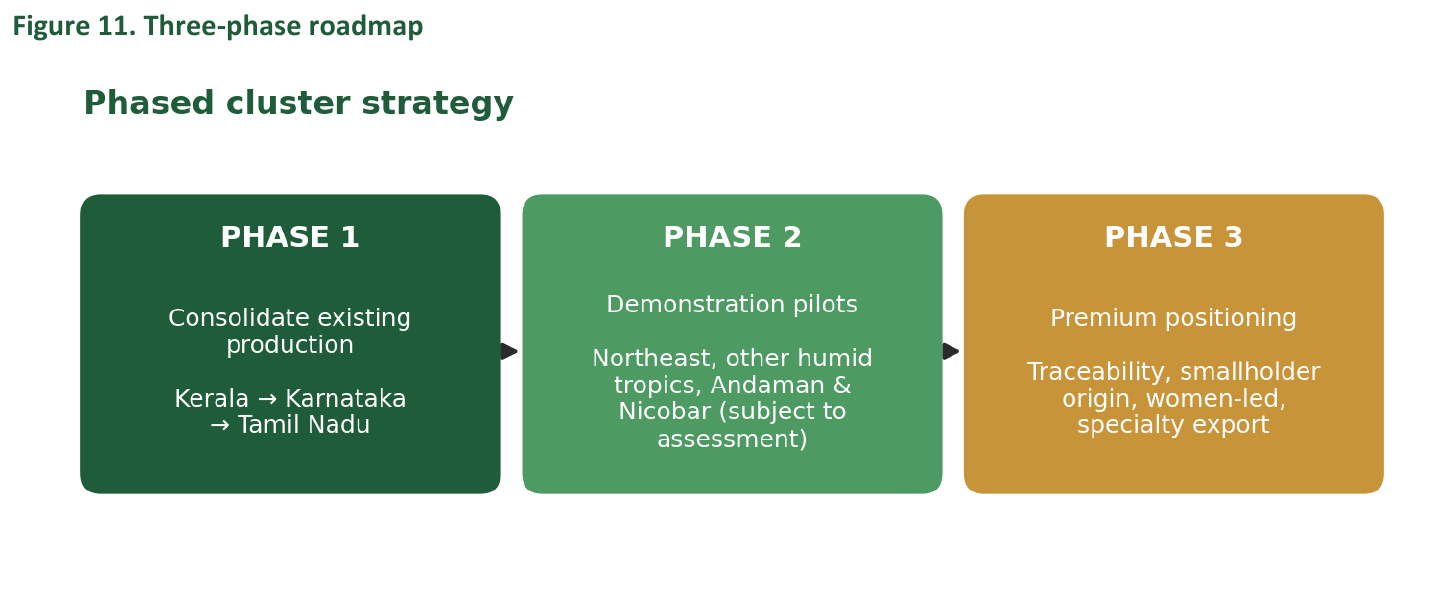
Start with existing clusters in Kerala, Karnataka and Tamil Nadu before expanding geographically.
Treat pollination as a service industry with trained seasonal teams working across farms.
Build common curing infrastructure so farmers stop surrendering value by selling green beans.
Position on value, not volume: smallholder origin, traceability, quality and sustainability.
Secure buyer contracts before scaling cultivation, and track a balanced KPI set, not tonnes alone.
What the additional research adds
India has already lived the boom-bust. Green-bean prices fell from about ₹3,750/kg (2003) to under ₹300/kg (2005) after global prices collapsed, leaving southern growers without buyers. Price risk is the central risk, so contracts and processing capacity must come before acreage.
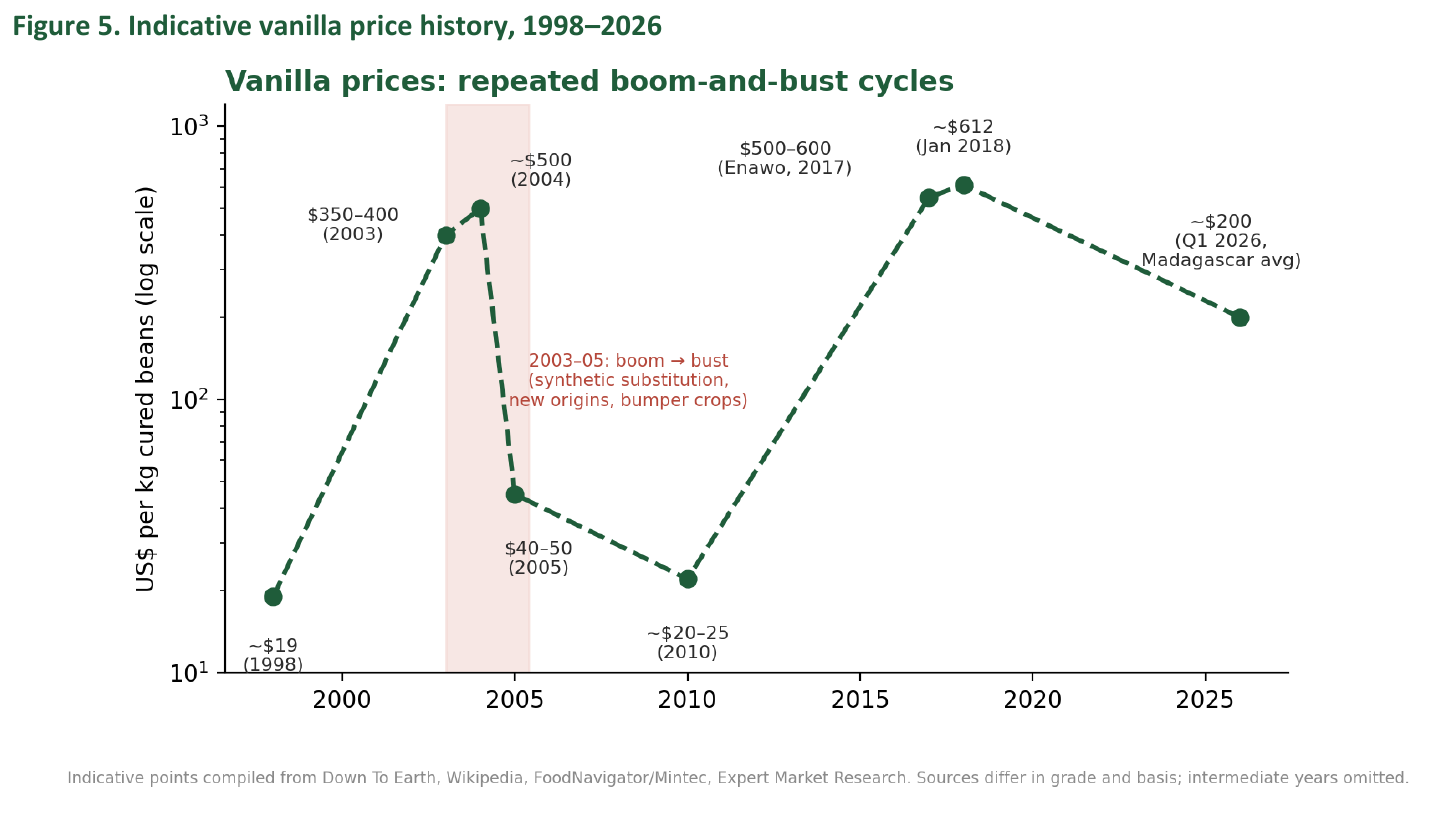
Global prices swing by 20x or more: about $19/kg (1998), around $500 (2003–04), $20–25 (2010), $500–600 (2017), and roughly $200 on one Q1 2026 benchmark.
Current price signals conflict. Sampled export deals range from about $15 to $235/kg depending on origin, grade and basis. The case-study scenarios (≈$45–95/kg) sit in the middle of that range, so they are plausible but should be replaced with contracted prices.
Buyers want diversified origins. Flavour houses have shifted sourcing toward Uganda, Indonesia and India after Madagascar shocks, and some guarantee minimum prices to farmers. This is the demand-side opening for a traceable Indian origin.
Past government support covered only planting material and on-farm curing units. It did not cover pollination services, aggregation or market linkage, which is exactly the gap this model fills.
1. The Business Question
Core question. How can India develop a profitable and resilient vanilla value chain without exposing small farmers to excessive production, labour and price risk?
The problem has four dimensions:
Production risk: vanilla needs a specific tropical environment and shade.
Labour risk: flowers must be hand-pollinated within a very short window.
Post-harvest risk: green vanilla has little of the final aroma and value; proper curing is essential.
Market risk: international vanilla prices have historically been extremely volatile.
Simply encouraging farmers to plant vanilla is therefore unlikely to create a sustainable industry. The opportunity lies in an integrated system:
Farmer → Production → Pollination → Collection → Curing → Quality control → Branding → Premium buyer
2. Why Vanilla?
Vanilla (Vanilla planifolia) is a climbing orchid native to Mexico, now cultivated across tropical regions. It is used in food, beverages, confectionery, bakery, pharmaceuticals, cosmetics and fragrances.
From a business perspective the crop is attractive because it is high-value, can be grown by smallholders, can be intercropped, creates significant value during curing and processing, can earn premiums for quality and traceability, and has established international demand. However, the same characteristics that create value also create high operational risk.
3. Global Vanilla Market
FAOSTAT-derived 2024 data puts global production at approximately 7,115 tonnes. Madagascar is the largest producer, followed by Indonesia, Mexico and Papua New Guinea.
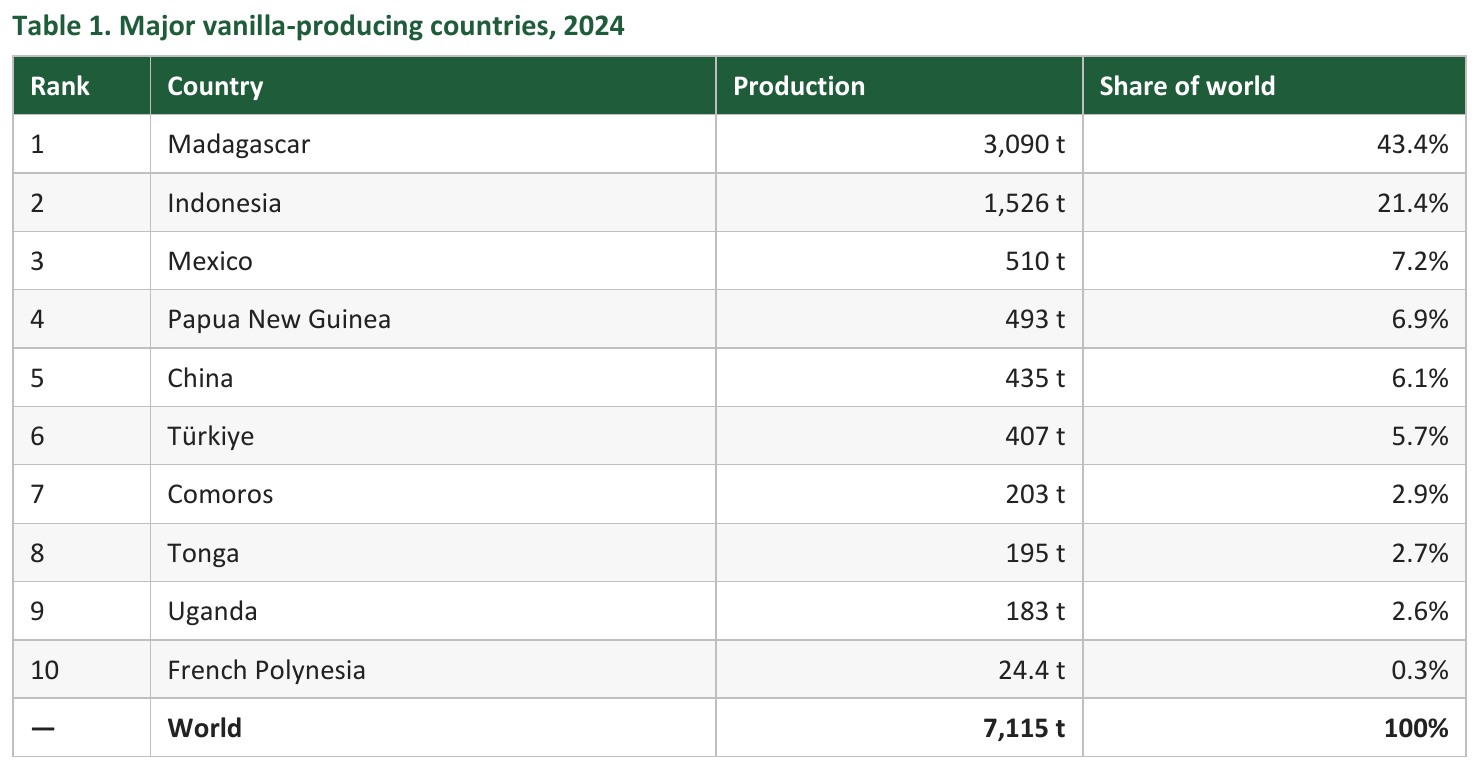
Source: FAOSTAT, 2024, as compiled by Commodity Origins and Terra Cultiva. Some country observations are estimated or imputed; treat as indicative.
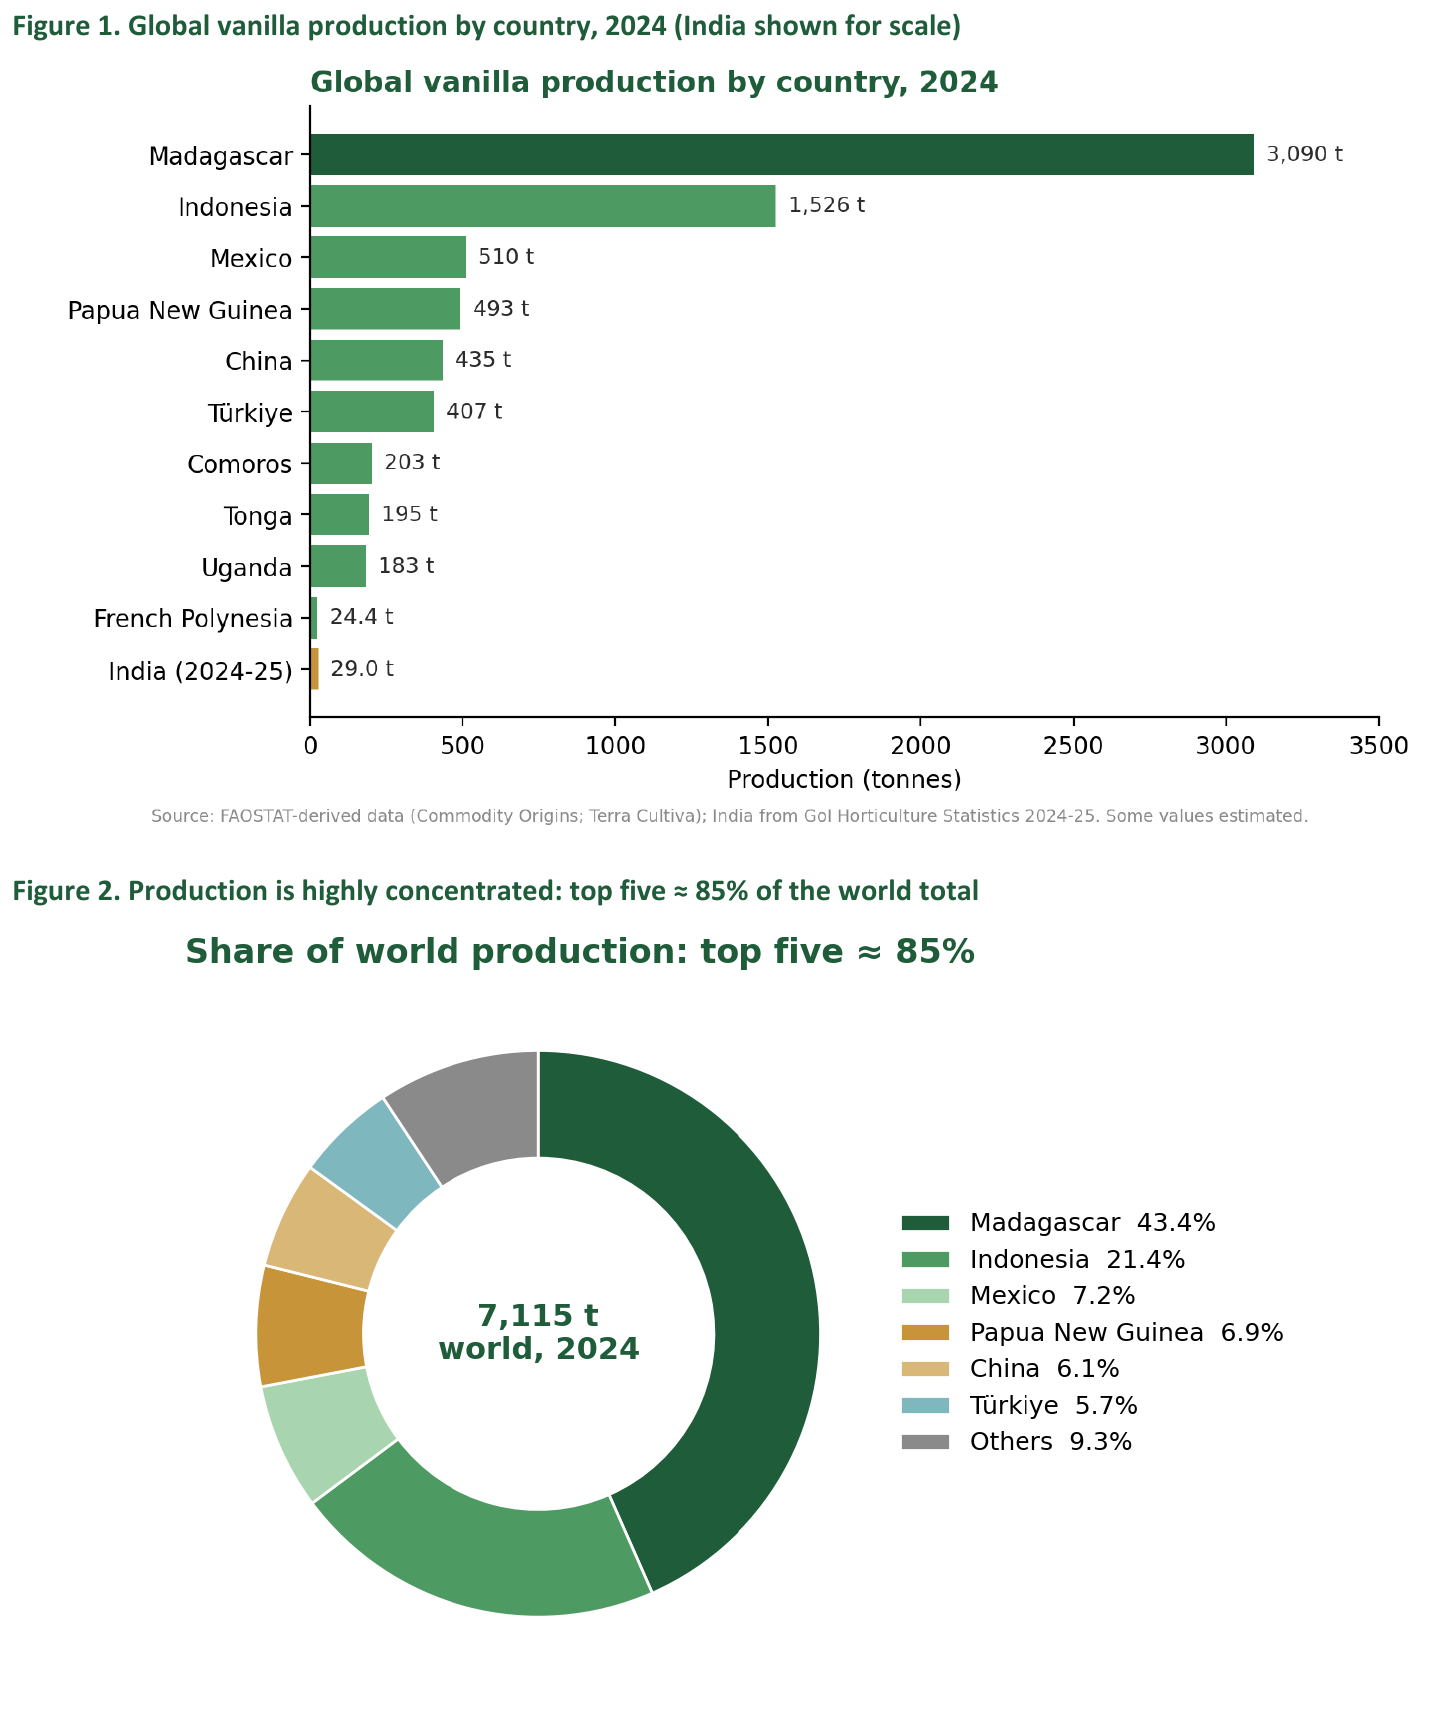
Business implication. The market is concentrated enough that disruption in a major producing country can have an outsized effect on supply and prices.
Data caution. Madagascar is often cited as supplying 80% or more of the world's natural vanilla, but FAOSTAT-based production data shows about 43%. The gap reflects differences in basis (reported production vs. trade/cured weight, and estimated or imputed country figures). Use the 43% figure for production shares, and treat any headline concentration number with care.
4. What India Looks Like Today
India's industry is very small compared with the global leaders. The 2024–25 final horticulture estimates from the Government of India's Horticulture Statistics Division show:
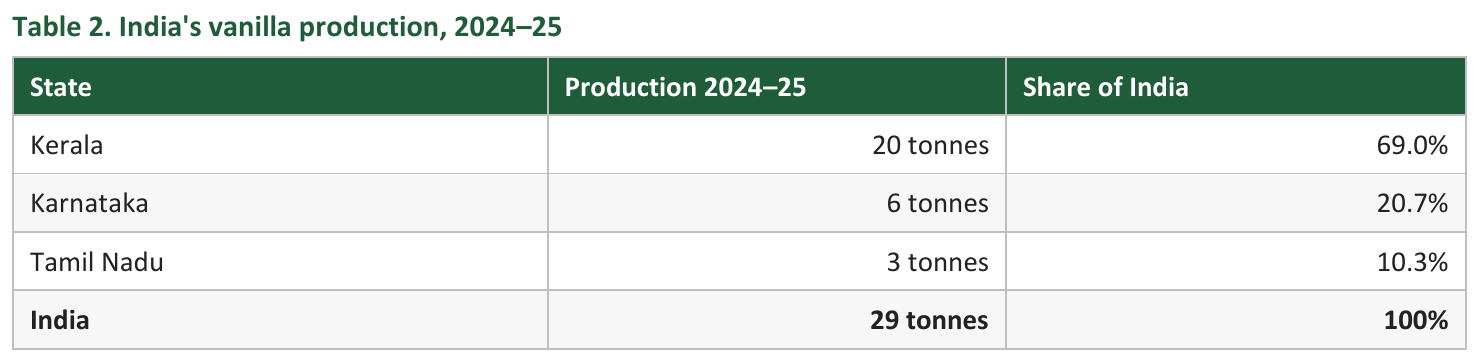
Source: GoI, Area and Production of Horticulture Crops, 2024–25 Final Estimates.
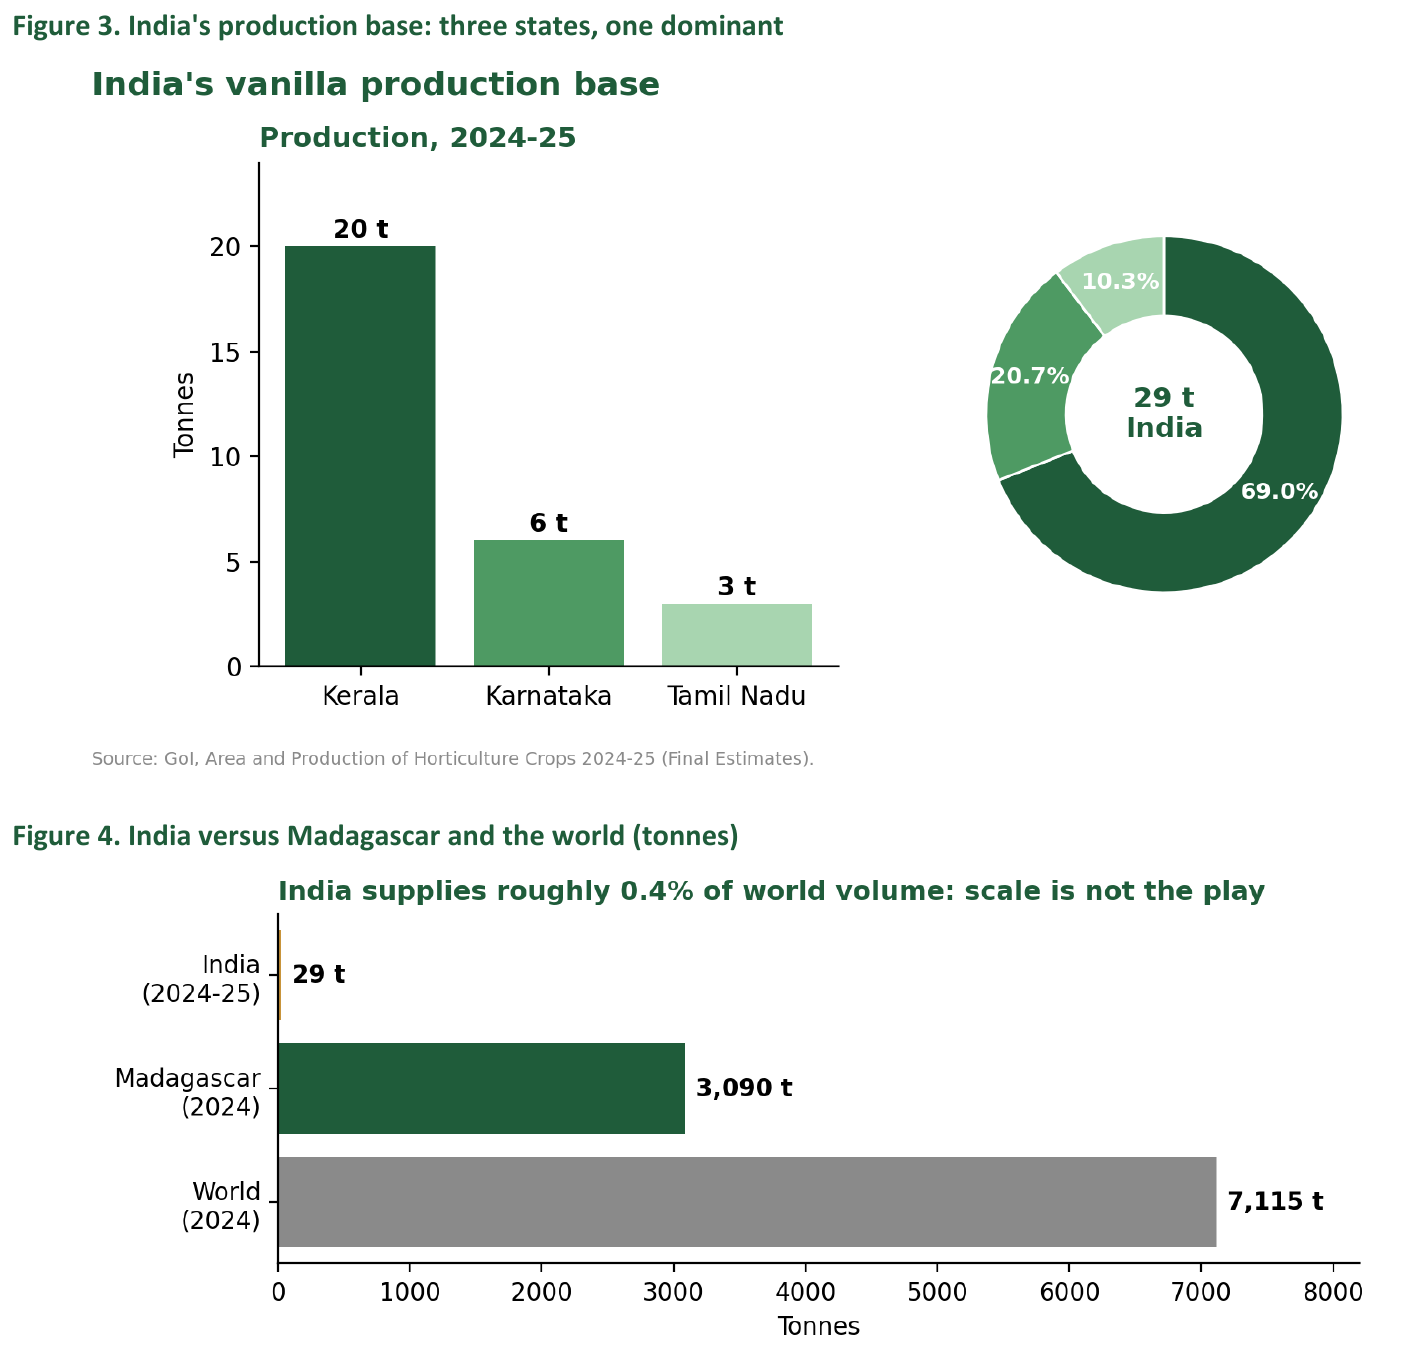
Indian production has also been volatile. Karnataka's output fell from 30 tonnes in 2021–22 to 6 tonnes in 2024–25, while Kerala remains the largest producer.
India does not only have a production problem. It has a value-chain resilience problem.
5. Price History: Boom, Bust and India's Own Crash
Vanilla's defining commercial feature is not its high price but its unstable price. Cyclones and political disruption in Madagascar drove prices from roughly US$19/kg in 1998 to around US$350–500/kg in 2003–04. High prices then pulled new origins into production and encouraged food manufacturers to switch to synthetic vanillin, and prices fell back to about US$40–50/kg by 2005 and roughly US$20–25/kg by 2010. Cyclone Enawo (March 2017) triggered a second spike to about US$500–600/kg, with a January 2018 market estimate near US$612/kg.
India's 2003–05 crash
The same cycle hit Indian growers hard. High prices drew a rapid expansion of cultivation in Kerala, Karnataka and Tamil Nadu; Kerala accounted for about 70% of the new area. When world prices fell, Indian green-bean prices dropped from about ₹3,750/kg in 2003 to under ₹300/kg in 2005. Major buyers reported that they were not purchasing, and growers' associations were selling small pouches of cured beans directly and advance-selling to farmer organisations at around ₹250/kg.
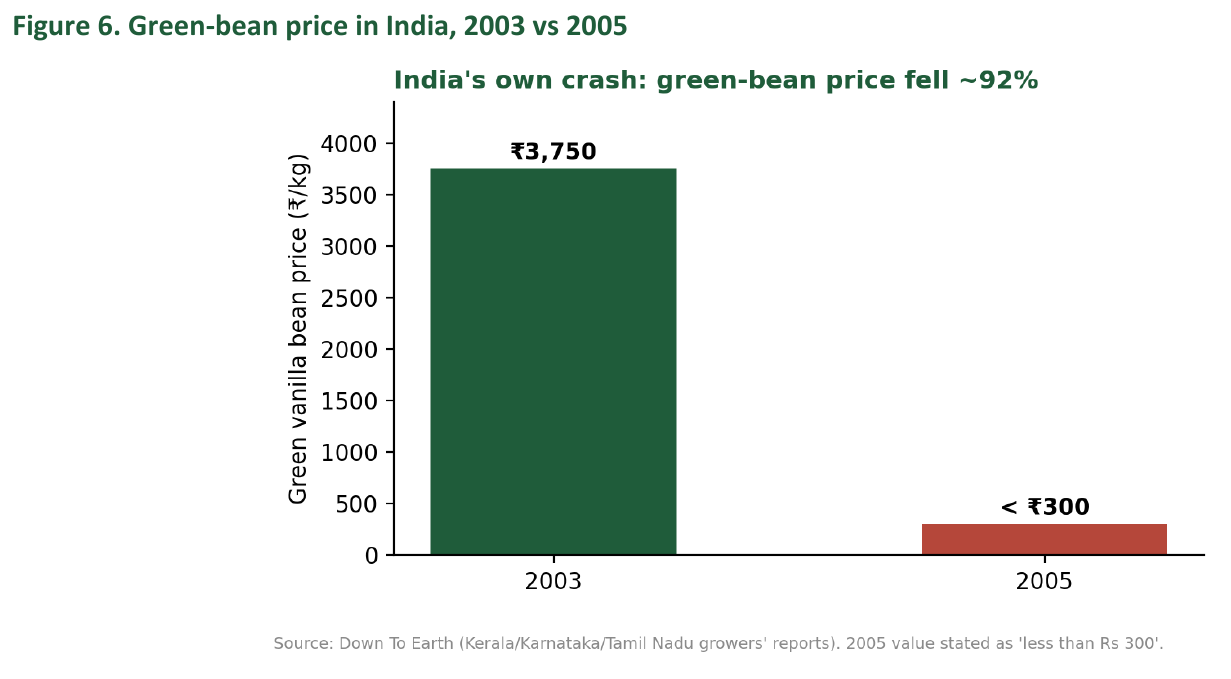
Lesson from India. A planting-led boom, with no curing capacity, buyer contracts or price floor, left Indian growers exposed in 2005. Today's volatility is the same structural problem, which is why this case study puts services and offtake ahead of acreage.
The earlier optimism is also instructive. A Spices Board status paper of that period projected strong lifetime returns even at low world prices, and commentary suggested that replacing just 10% of India's synthetic vanillin imports with natural vanilla would need about 2,020 tonnes of cured beans from over 6,700 ha. India's 2024–25 output of 29 tonnes shows how far reality has been from such projections, and why demand-side claims should be tested against contracted offtake.
6. Where Can Vanilla Be Grown in India?
Vanilla needs a warm, humid tropical environment. The Spices Board identifies these broad requirements:
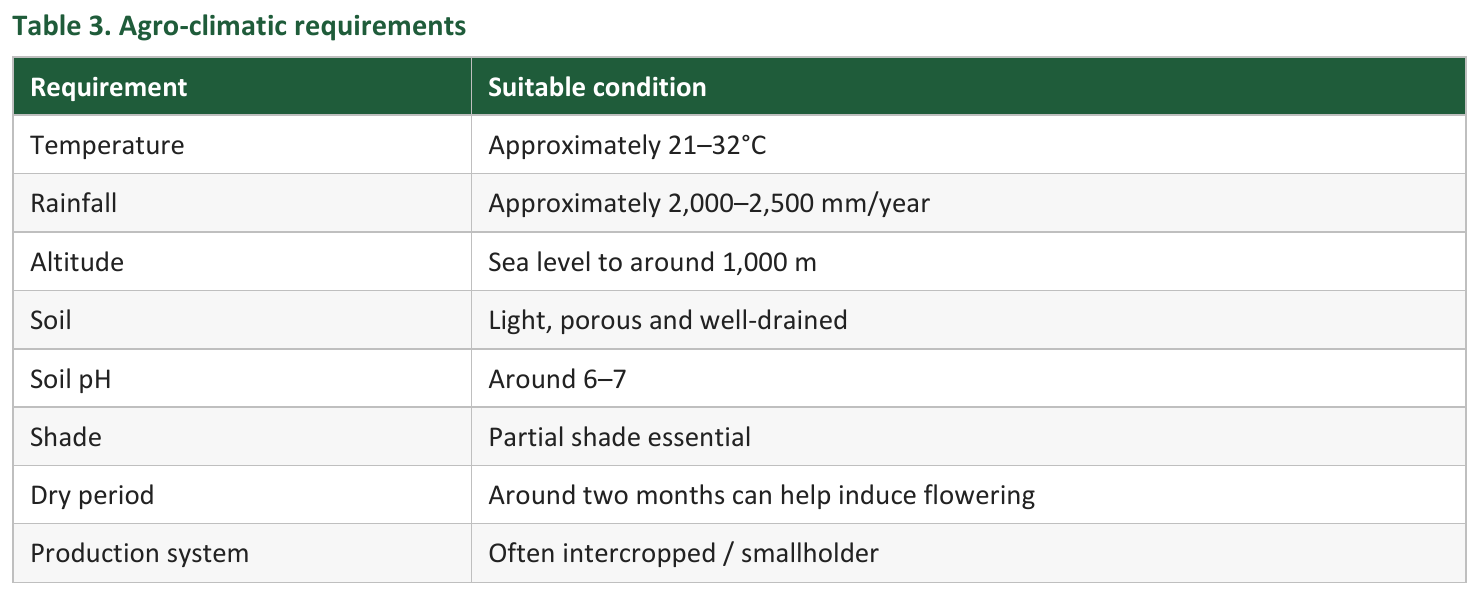
Source: Spices Board India.
Vanilla should not be promoted uniformly across India; agro-climatic screening must precede expansion.

The second group should be treated as pilot opportunities, not established commercial vanilla regions.
7. Why Vanilla Is Different From Normal Crops
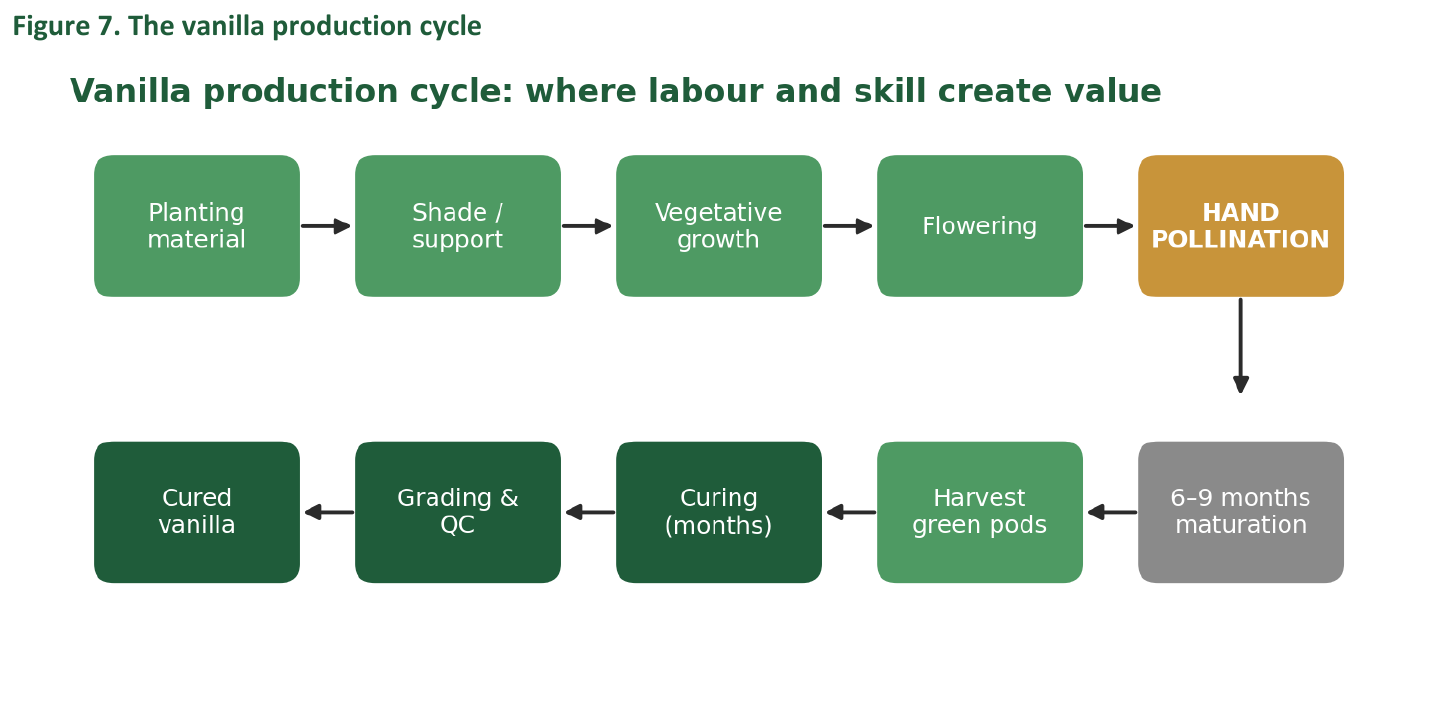
Vanilla is a high-value, high-touch crop. Its production cycle contains several points where labour and technical knowledge determine final value. ICAR-IISR notes that outside Mexico, most production needs hand pollination and careful curing over several months.
8. The Critical Bottleneck: Pollination
Outside its native Mexican environment, vanilla generally requires artificial pollination. According to Tamil Nadu Agricultural University (TNAU) guidance, pollination must be carried out on the day the flowers open, with an effective window from roughly 4 a.m. to 1 p.m.. A skilled worker can pollinate about 1,000– 1,500 flowers per day.
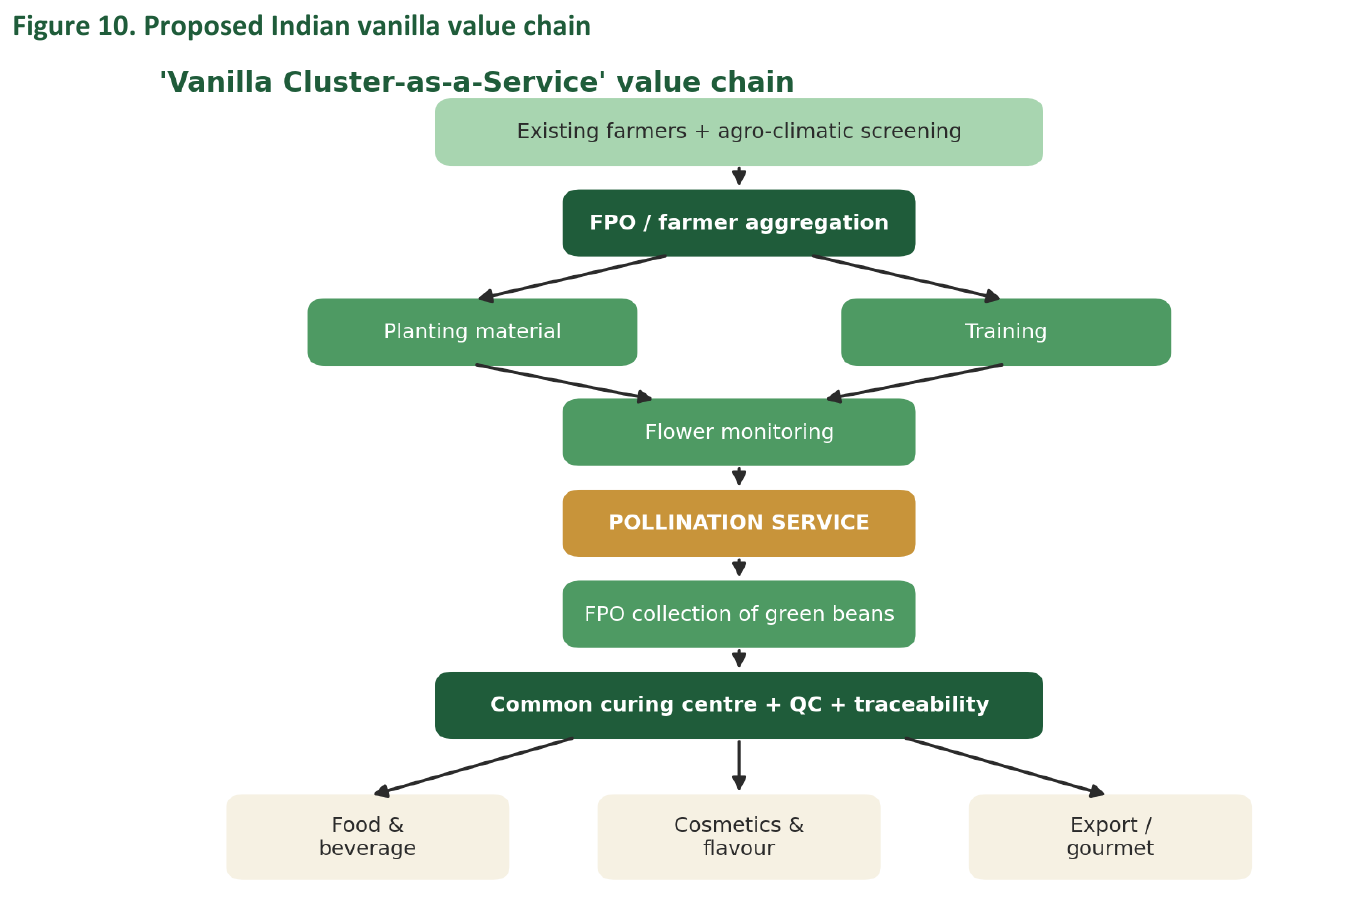
This creates demand for a specialised seasonal workforce. A cluster could run a Vanilla Pollination Service rather than expecting every farmer to develop the skill alone:
Farmer clusters identify the flowering period
Pollination workers are trained
Workers are deployed farm-to-farm
Flowers pollinated are recorded
Expected harvest is tracked
The FPO collects the crop This converts an individual farmer problem into a shared-service business.
9. Harvesting and Yield
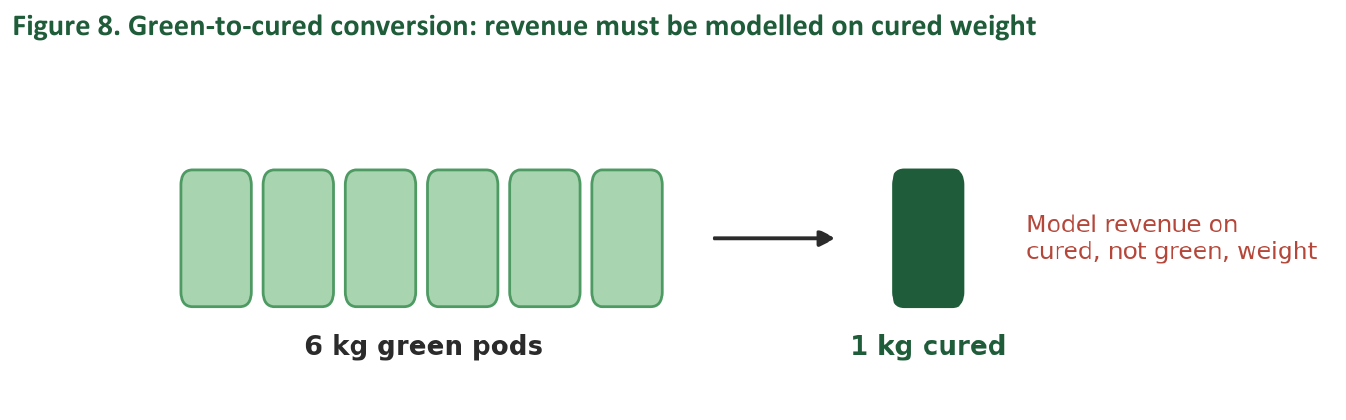
Pods mature roughly 6–9 months after flowering. TNAU reports an average cured-bean yield of roughly 300–600 kg/ha/year under suitable conditions, and notes that about 6 kg of green pods yield 1 kg of cured beans. These are technical benchmarks, not guaranteed commercial yields.
10. Curing Is Where Much of the Value Is Created
Freshly harvested vanilla lacks the characteristic aroma. Curing triggers the biochemical processes that develop vanillin and other flavour compounds. Kerala Agricultural University describes a sequence of killing/scalding, sweating, drying, slow shade drying, conditioning, and grading and storage; the slow stages can extend over several months.
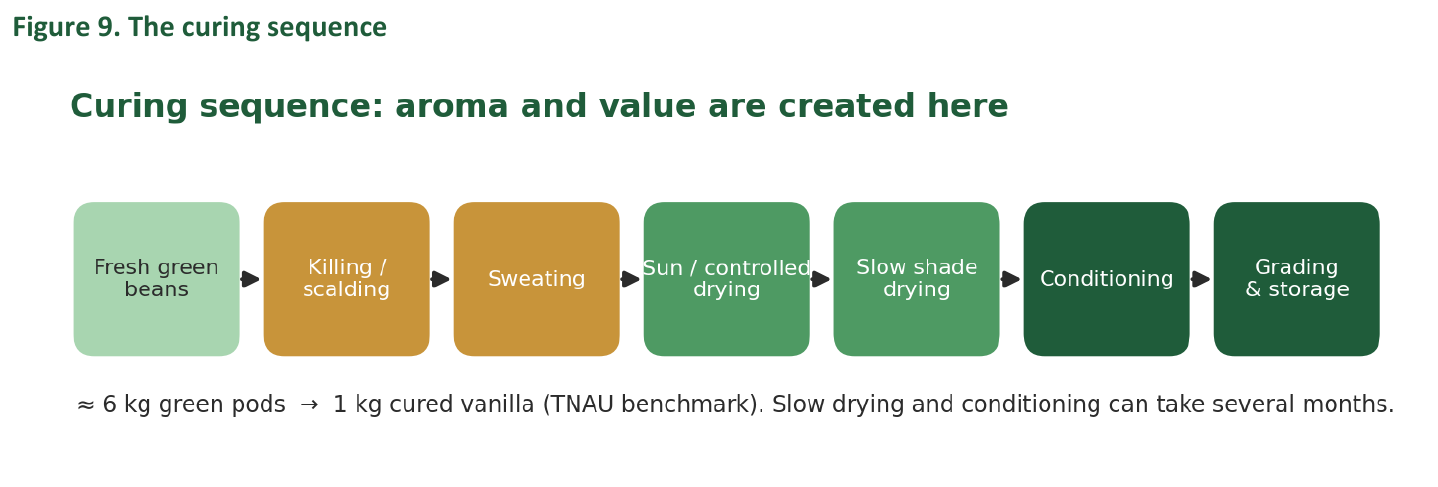
Strategic implication. If Indian farmers sell only green beans to intermediaries, they surrender a major share of potential value. A common curing centre is therefore a key element of the model.
11. International Benchmarks
Madagascar: the scale benchmark
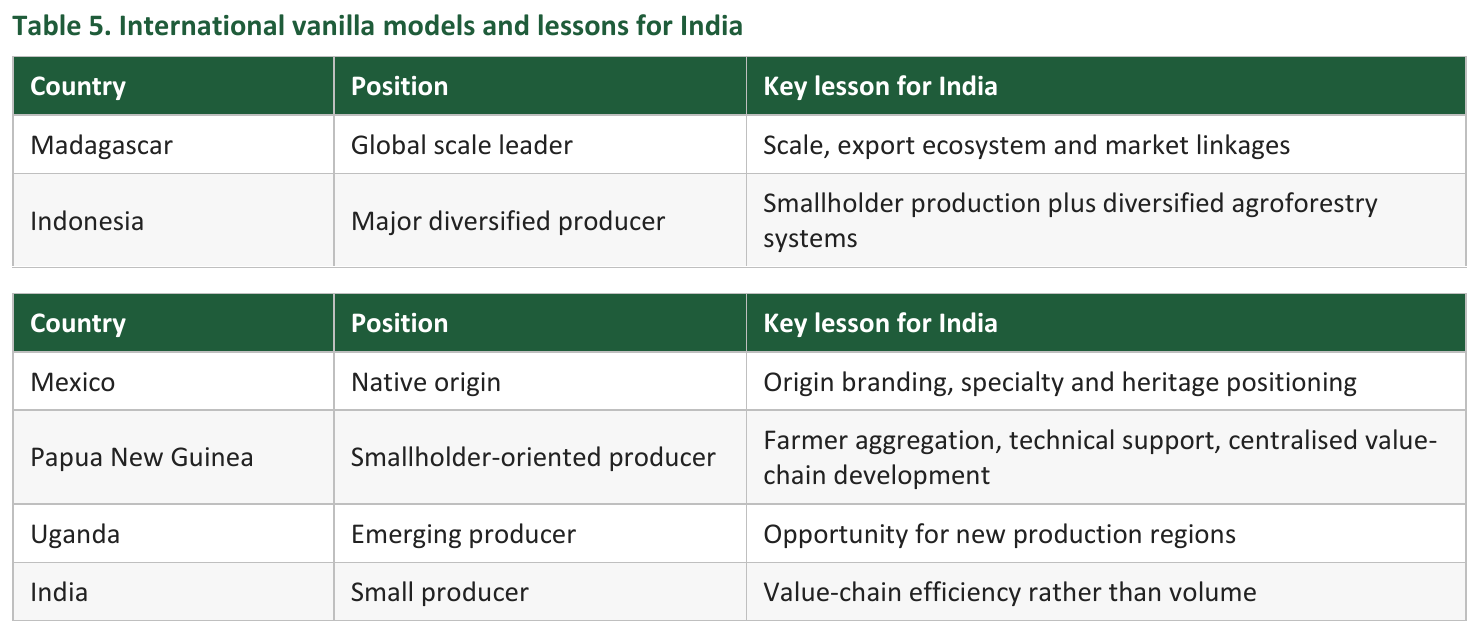
Madagascar supplies about 43% of reported global output and is the dominant exporter, but it also shows the risks of a concentrated base. The World Bank has documented large price swings linked to weather shocks, supply bottlenecks and speculation, with prices at one point reaching hundreds of US dollars per kilogram, far above long-term averages.
Lesson. India should not copy Madagascar's volume model. Build resilience before scale.
Indonesia: diversification and quality
Indonesia, the second-largest producer at about 1,526 tonnes in 2024, is known for origins such as Bali, Sulawesi and Sumatra, and research notes growing substitution between Indonesian and Malagasy vanilla. India can compete through differentiated origin, quality, traceability, processing, specialty vanilla and domestic premium markets.
Papua New Guinea: the most relevant benchmark
PNG's vanilla sector is heavily smallholder-based. FAO reports about 17,000 smallholders involved, with around 80% of production in East and West Sepik. The sector has struggled with farmer knowledge, quality management, curing, storage and market access. The FAO/EU-STREIT programme responds with farmer training, improved planting material and farm practices, better drying and curing, packaging and storage, market linkages, women and youth participation, and stronger local institutions. Recent FAO reporting (2026) again stresses the nine-month cycle, disease management, solar dryers and improved storage.
Lesson. PNG offers the strongest model for an Indian smallholder + cluster + common-processing strategy.
Buyer pull: why traceable Indian origin has an opening
After Madagascar's supply shocks, large flavour houses publicly diversified sourcing toward Uganda, Indonesia and India. Some also guarantee farmers a minimum price, paying above market when prices are low. Industry commentary also points to rising demand for natural vanilla, single-origin, organic and certified beans in food, beverage and cosmetics. Together these signal that buyers value reliability and traceability, which a cluster model is designed to supply, and that a price-floor contract is a realistic ask in negotiations.
12. The Proposed Indian Business Model
“Vanilla Cluster-as-a-Service”
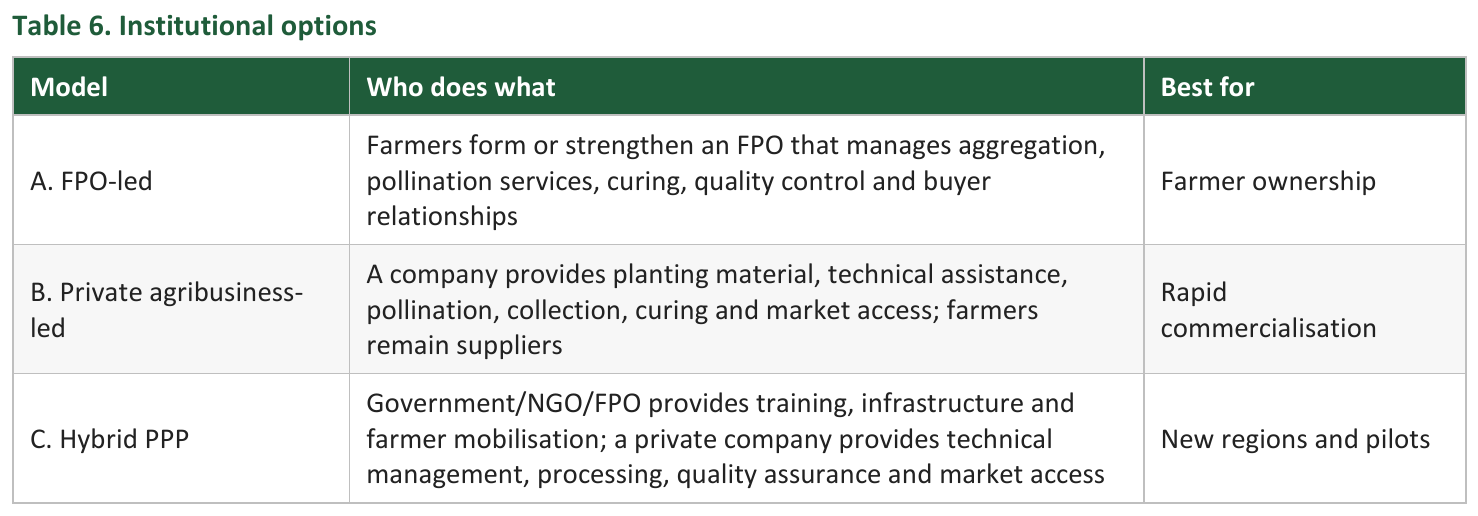
Instead of handing farmers seedlings and leaving them to run the whole chain, an organised system provides services across the production cycle.
Who could operate the model?
Why clusters make economic sense
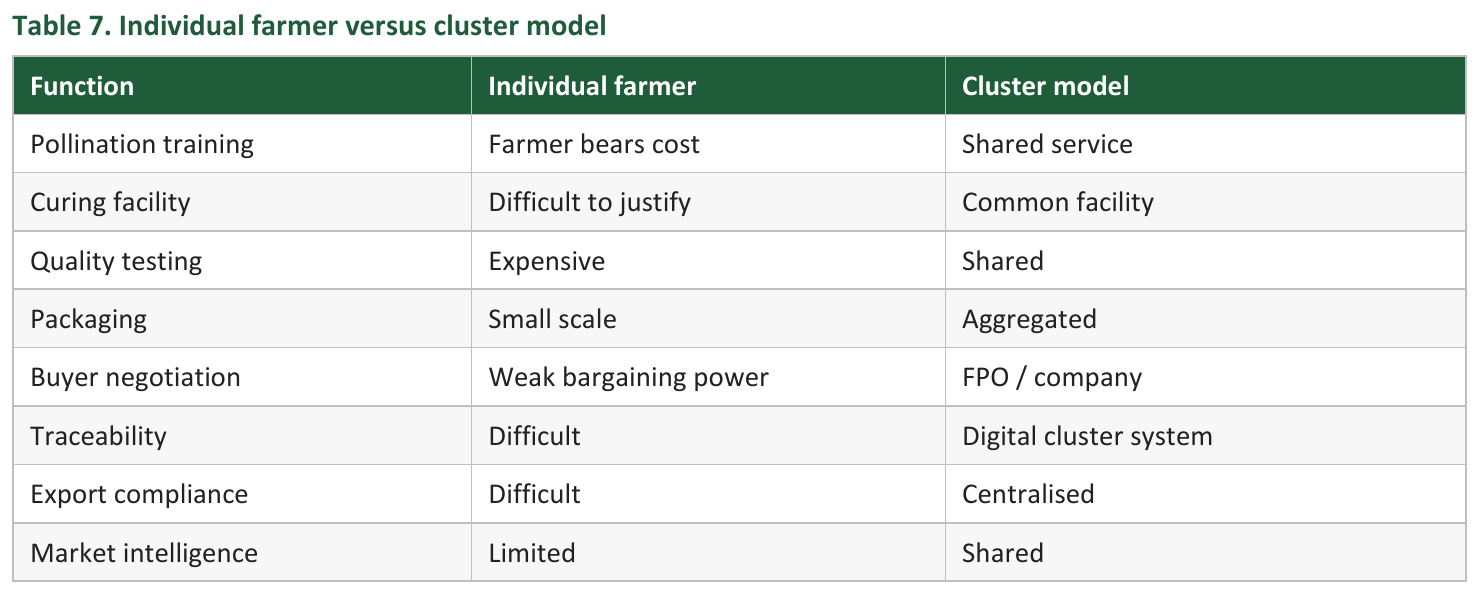
Individual smallholders face fixed costs that are hard to carry alone. Aggregation improves unit economics.
Phased cluster strategy
13. Buyers and Revenue Opportunities
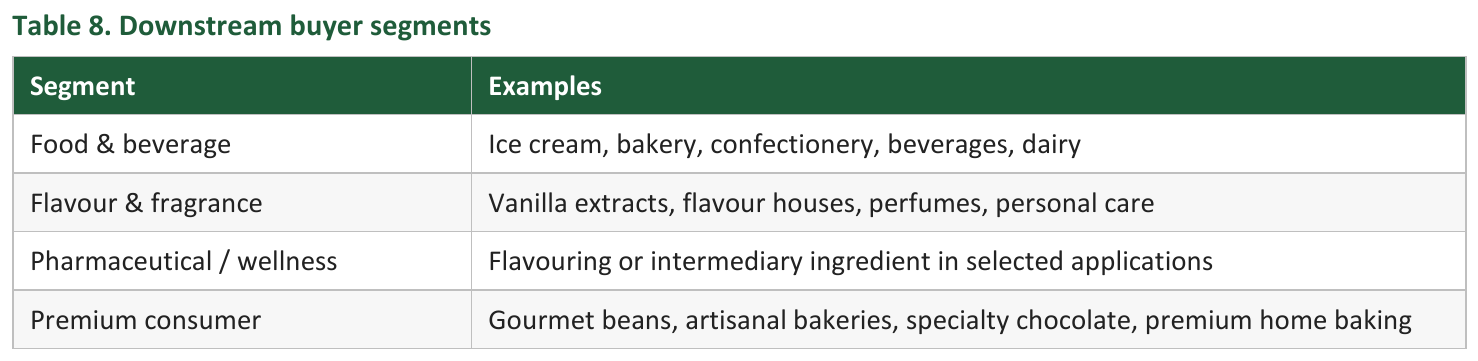
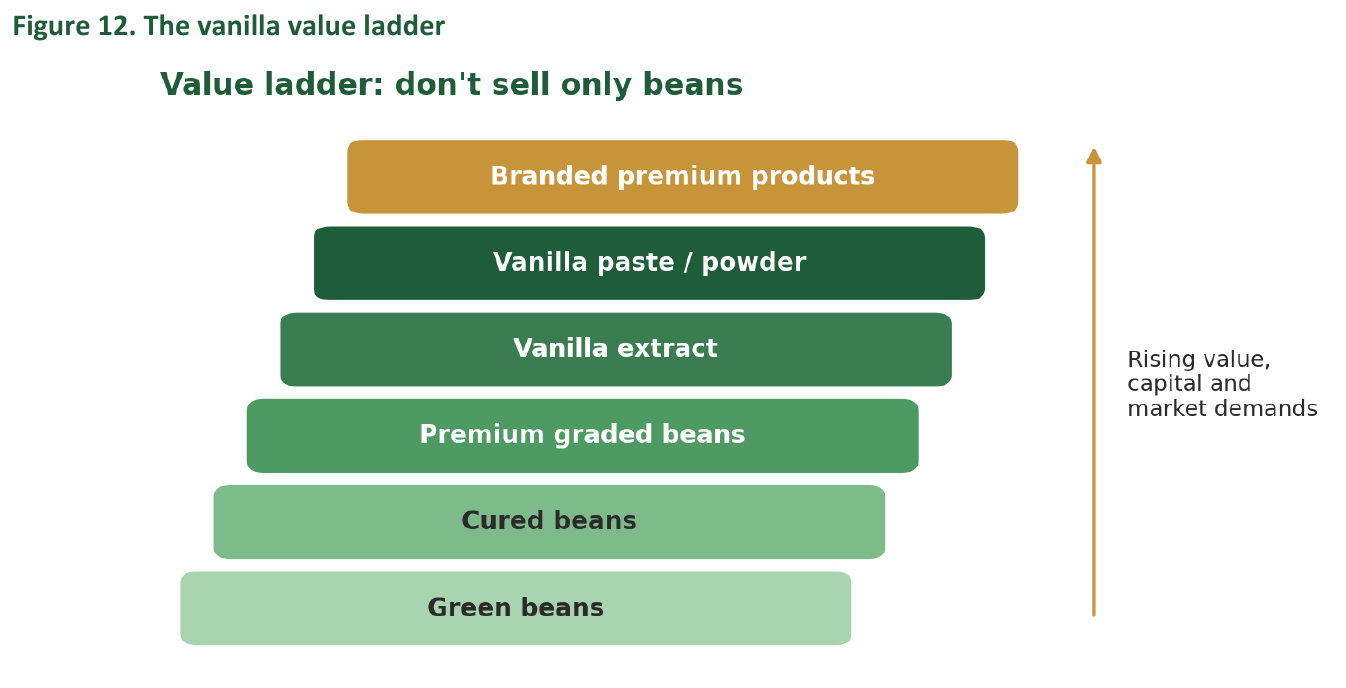
A key strategic shift: don't sell only beans, sell products. Each processing step can capture additional value, though each also adds capital, regulatory, quality and market requirements.
14. Illustrative Farm Economics
A real investment model should use local farm-gate prices, labour and curing costs and actual buyer contracts. To show sensitivity, consider three illustrative scenarios:
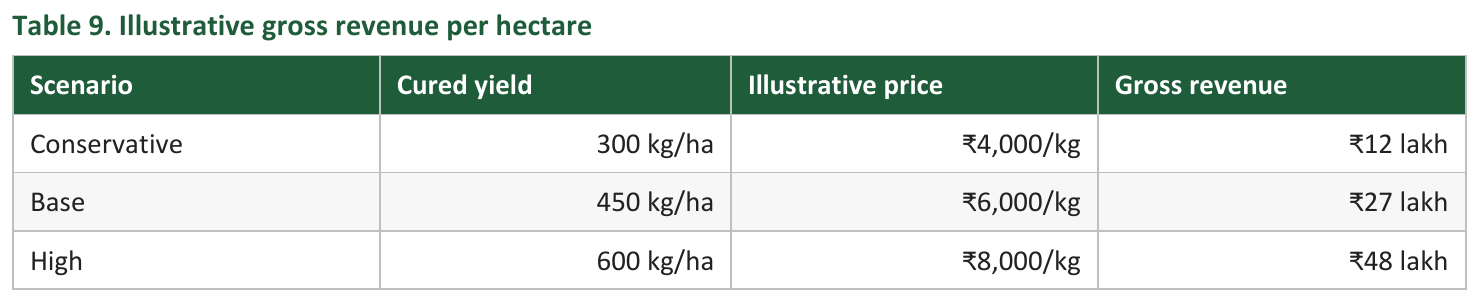
These are scenario assumptions, not current market quotations or guaranteed farmer returns.
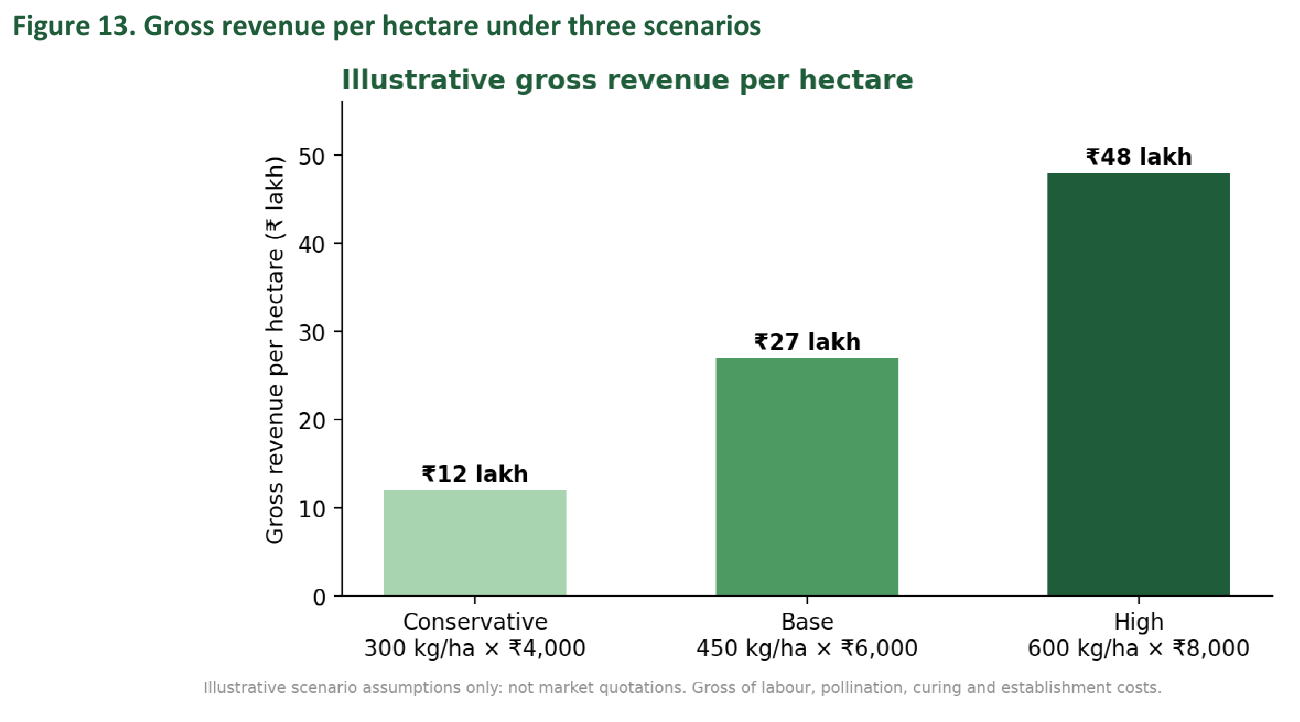
The 300–600 kg/ha technical range is supported by TNAU, but actual economics depend on labour, establishment costs, vine survival, pollination success, curing losses and selling price.
Investment question. The right question is not “How much can one hectare earn?” but “What is the risk-adjusted return after labour, pollination, curing, establishment and price volatility?”
Reality check: what are buyers paying?
Published price signals vary widely because they differ in grade, basis (farm-gate, FOB, retail) and sample. Tridge's sampled export transactions put Indian vanilla at roughly US$43–165/kg in 2024 (after US$166–235/kg in 2023), Indonesian beans around US$73–133/kg and Papua New Guinea around US$62–80/kg in early 2026, while Ugandan beans were far cheaper at about US$23–43/kg. Madagascar sample transactions ranged from about US$15 to US$120/kg, against one Q1 2026 benchmark average of about US$200/kg. High-quality retail beans in the US sold for roughly US$152–241/kg in mid-2025.
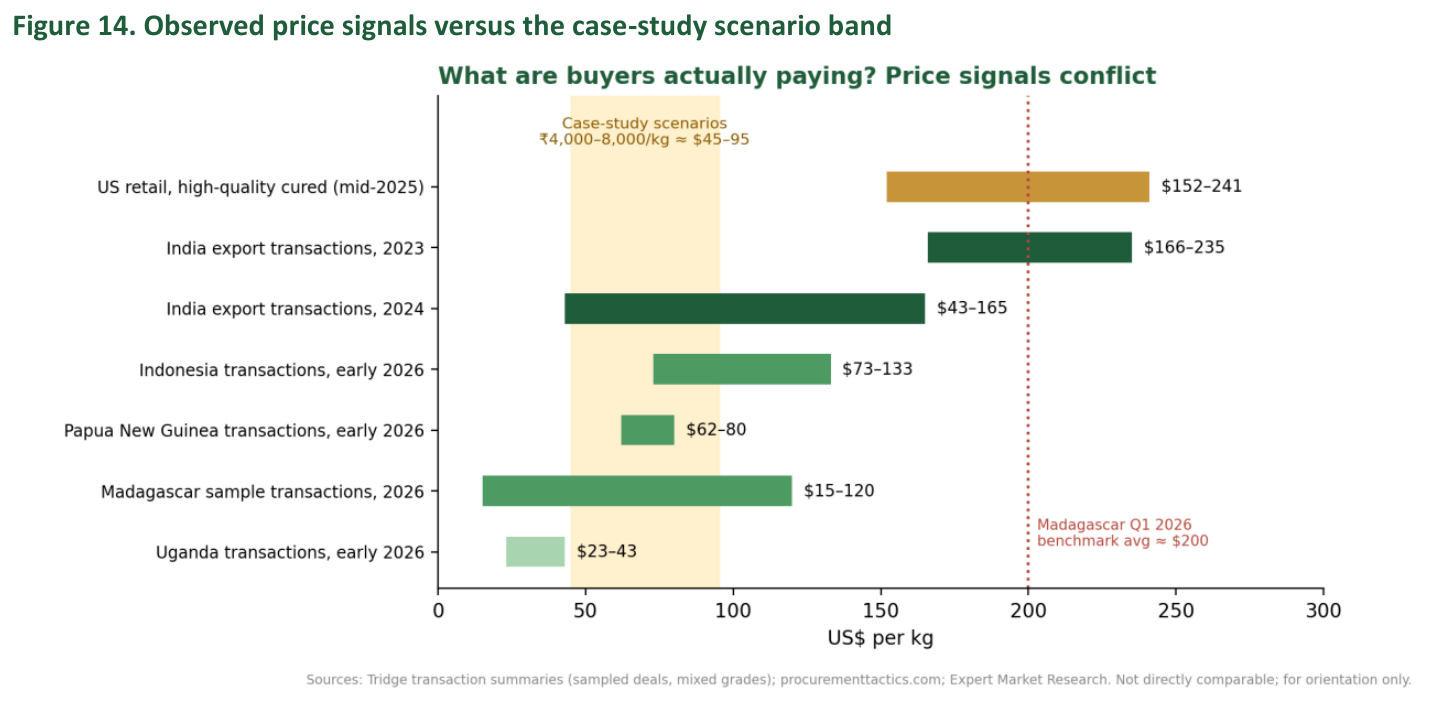
At about ₹85–90 per US dollar, the case study's ₹4,000–8,000/kg scenarios equal roughly US$45–95/kg: inside the observed export range, and well below retail prices. This suggests the scenarios are reasonable and even conservative for premium grades, but that real farm-gate prices will depend on grade and contract terms. The large gap between export and retail prices also shows how much value sits downstream of the farm.
Exchange rate is an approximation; update with the current rate before using these conversions.
Sensitivity to price and yield
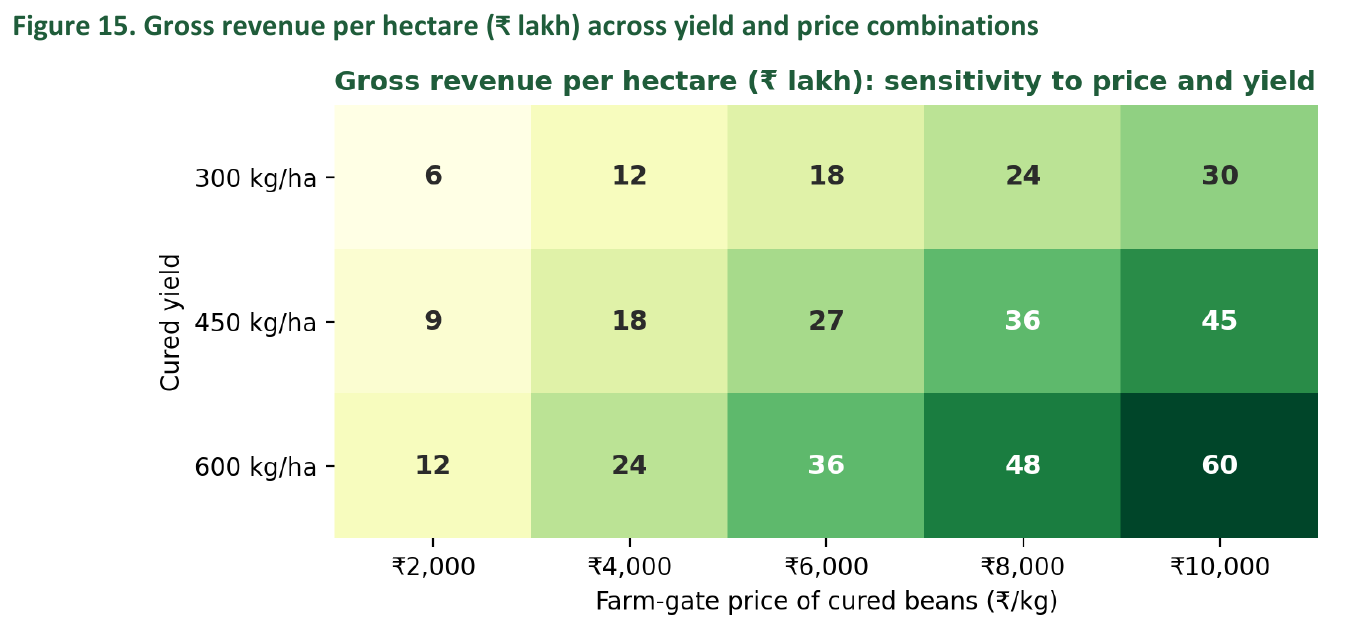
Gross revenue ranges from ₹6 lakh/ha (300 kg at ₹2,000/kg) to ₹60 lakh/ha (600 kg at ₹10,000/kg), a tenfold spread. Price assumptions drive results as much as yield. Because these are gross figures, a bankable model must deduct establishment, support structures, pollination and harvest labour, curing losses and working capital, and must test downside cases like the 2005 collapse.
15. Existing Government Support and the Gap
Public support for vanilla in India has historically been narrow. Records from the Spices Board and Parliament answers show assistance concentrated on planting material and on-farm curing units:
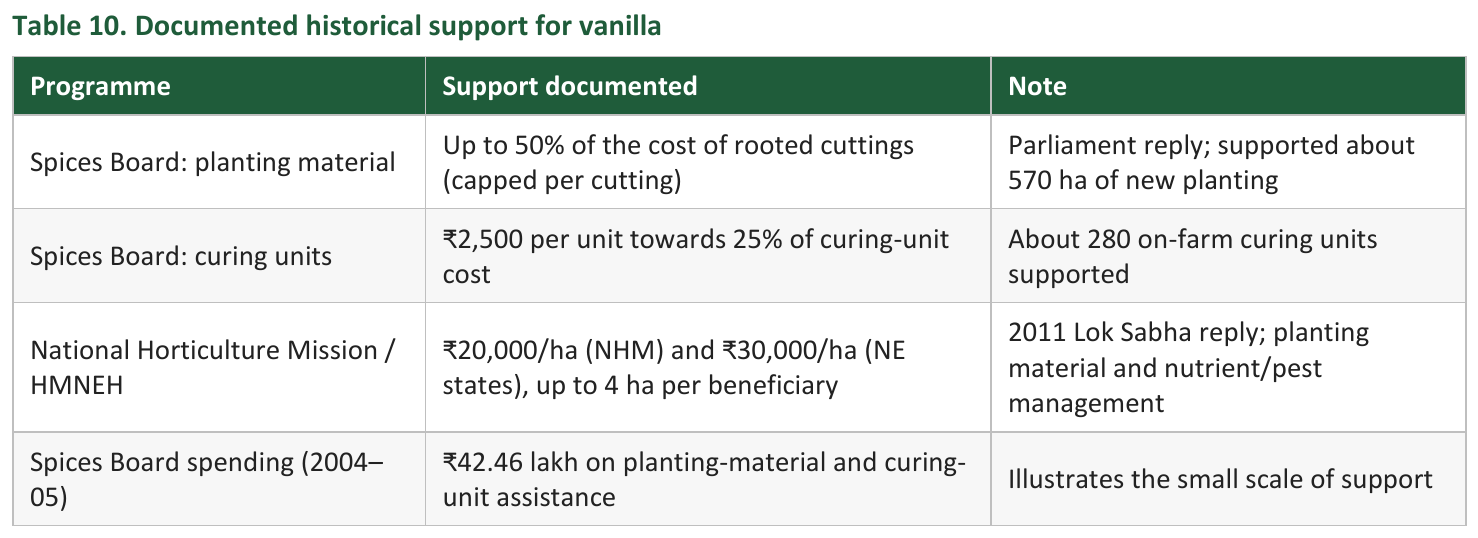
Sources: Lok Sabha/Rajya Sabha replies (2005, 2006, 2011) and Spices Board materials. These figures are dated; check current MIDH, Spices Board and state horticulture department norms before designing a pilot.
None of these instruments targeted pollination services, aggregation, shared curing at cluster scale, quality testing, traceability or buyer linkage. A cluster pilot would therefore need to blend existing planting and processing support with newer FPO and value-chain funding, and should confirm which current schemes can co-finance common curing centres and FPO working capital.
16. Key Risks and Mitigation
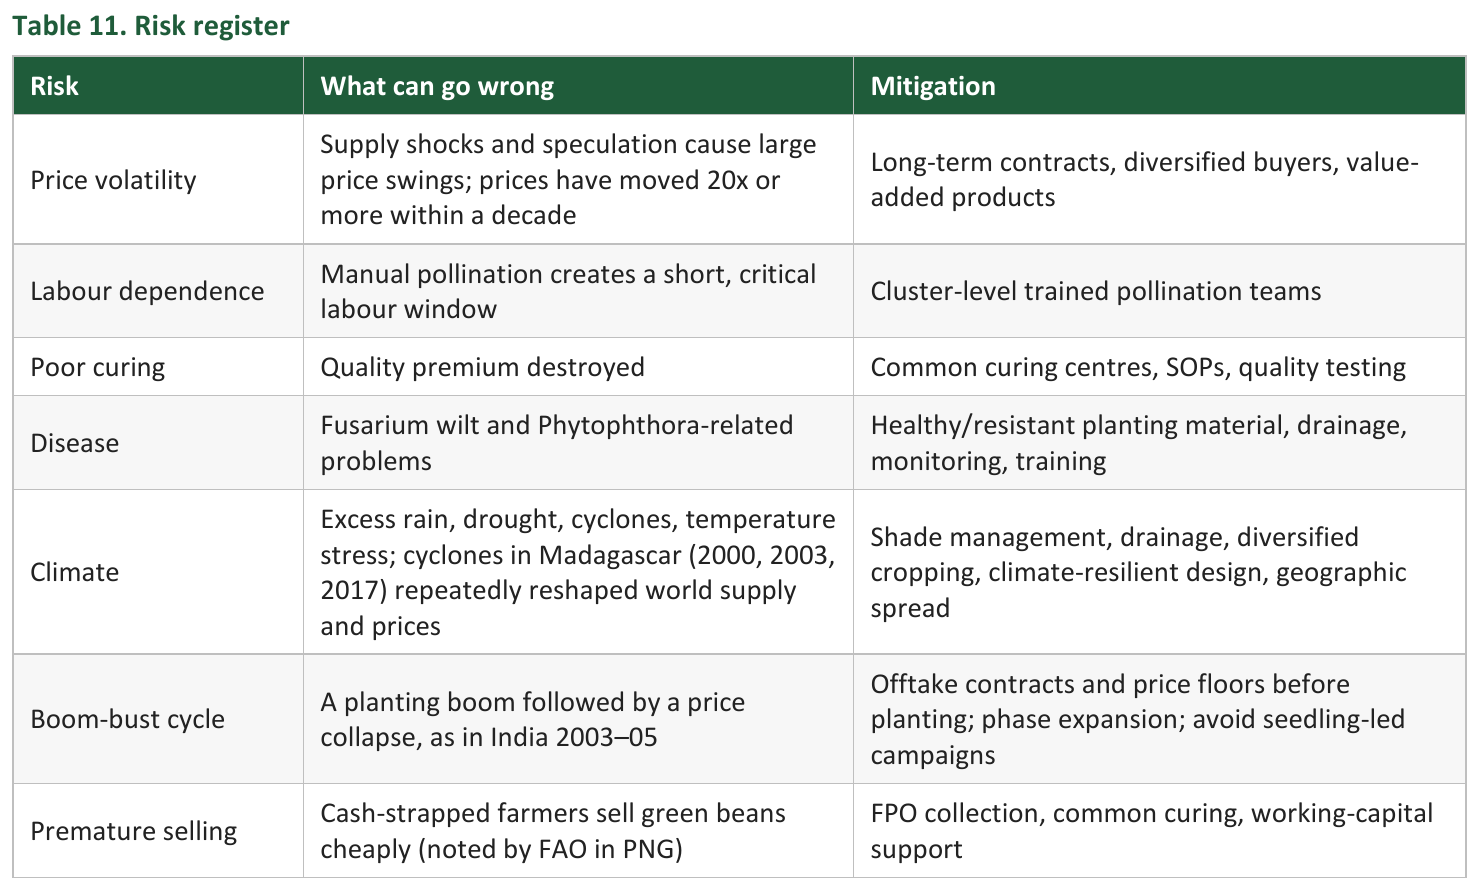
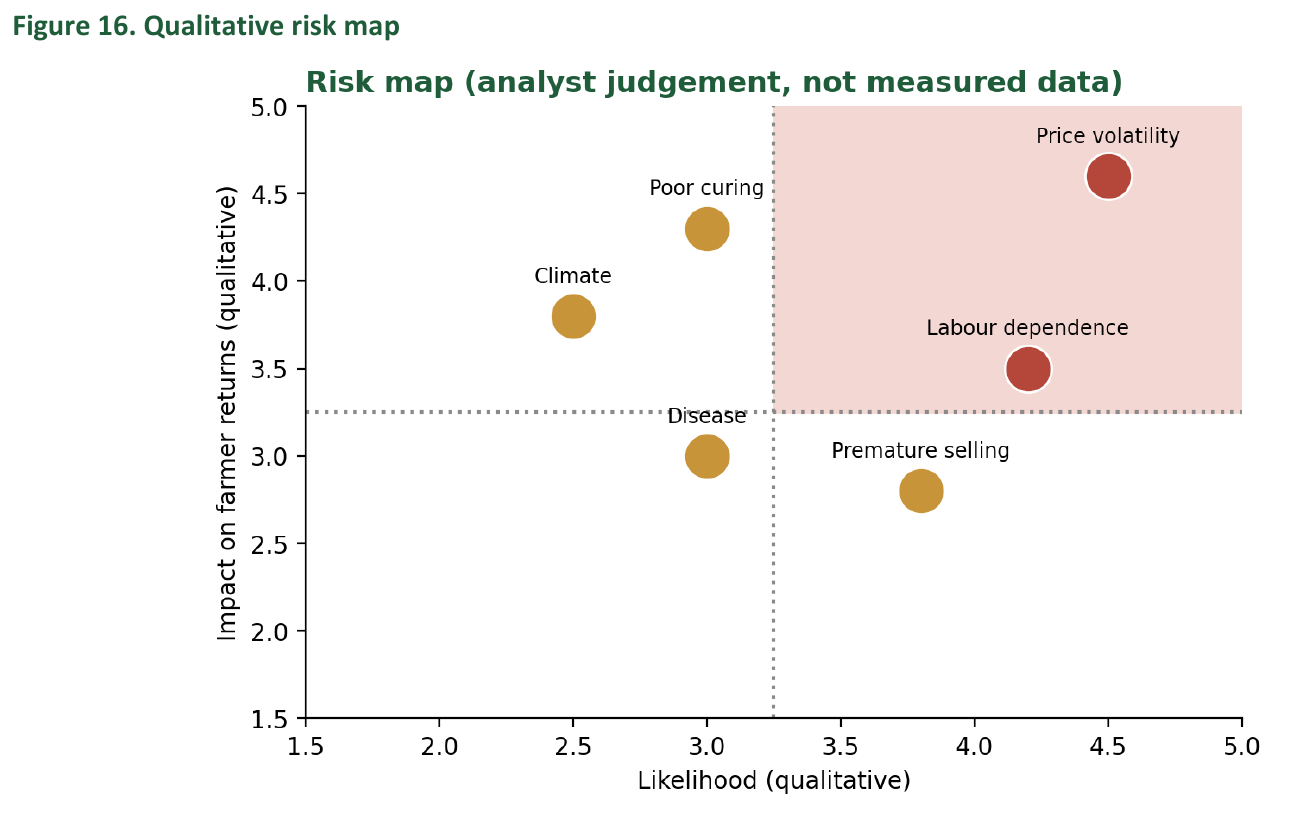
The risk map is an analyst judgement to prioritise attention, not measured data.
17. Livelihood, Gender and Sustainability
The value chain creates employment in pollination, harvesting, curing, grading, packaging, quality control, bookkeeping and aggregation. The PNG programme explicitly includes women and youth. India could deliberately foster women-led pollination and post-harvest enterprises, moving women from farm labourers to service providers and value-chain participants.
Vanilla also fits diversified farming rather than large monocultures. The Spices Board notes that Indian vanilla is mostly grown by small and marginal growers, often intercropped. A typical layered system pairs an upper canopy of coconut or arecanut with vanilla vines in the middle layer and shade crops or intercrops below, supporting soil organic matter, provided local ecology is suitable.
18. What India Should and Should Not Do

The weak approach ignores the most important constraints: labour, curing and market access.
19. Strategic Recommendations
Recommendation 1: Start with existing clusters
Prioritise Kerala, Karnataka and Tamil Nadu, where production knowledge and farmer networks already exist.
Recommendation 2: Treat pollination as a service industry
Create trained seasonal pollination teams across clusters, reducing the technical burden on individual farmers.
Recommendation 3: Build common curing infrastructure
Standardise processing, improve quality, cut individual capital needs, enable grading and strengthen bargaining power.
Recommendation 4: Move from commodity to premium positioning
Not another Madagascar: smallholder + traceability + quality + sustainability + processing.
Recommendation 5: Build buyer contracts before expansion
Identify food companies, flavour houses, gourmet brands, cosmetics firms and exporters first, to avoid supply without a market.
Recommendation 6: Develop digital traceability
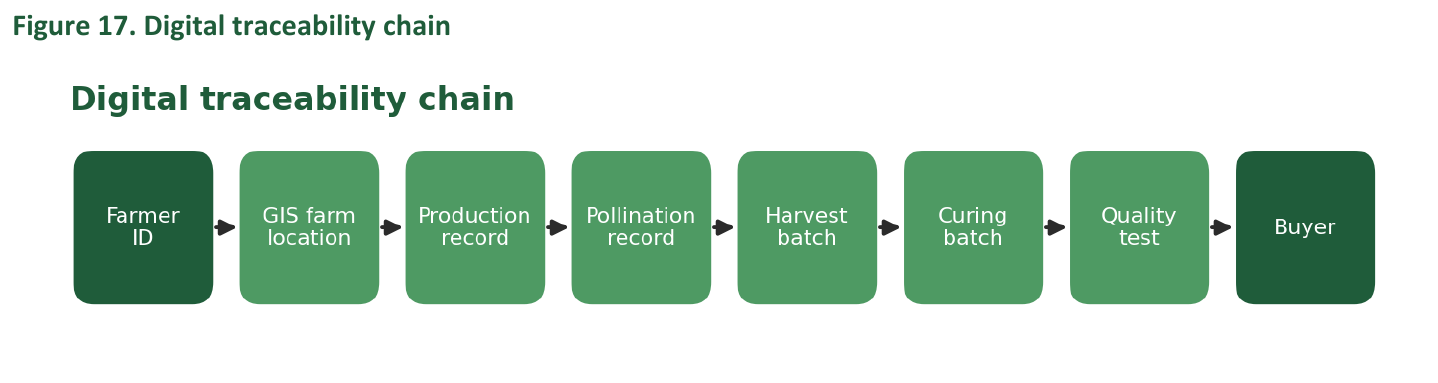
Record farm location, planting date, variety, pollination date, expected harvest, curing batch, quality grade and buyer.
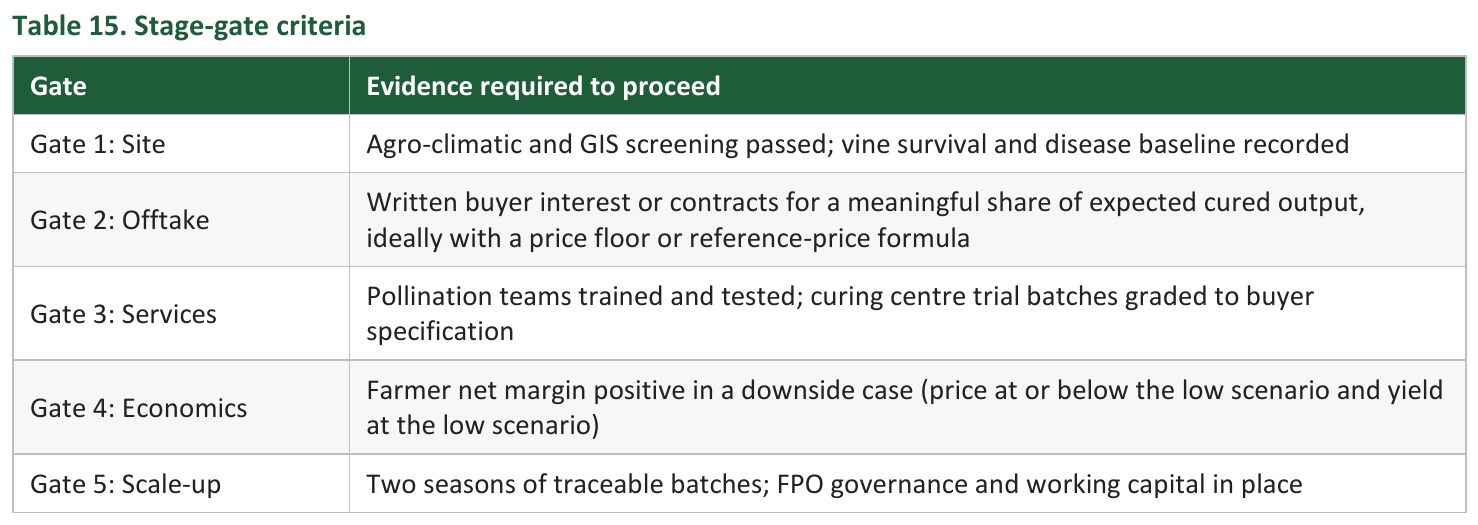
20. Proposed Pilot: “India Vanilla Cluster Pilot”
Geography: Kerala + Karnataka. Duration: 3–5 years.
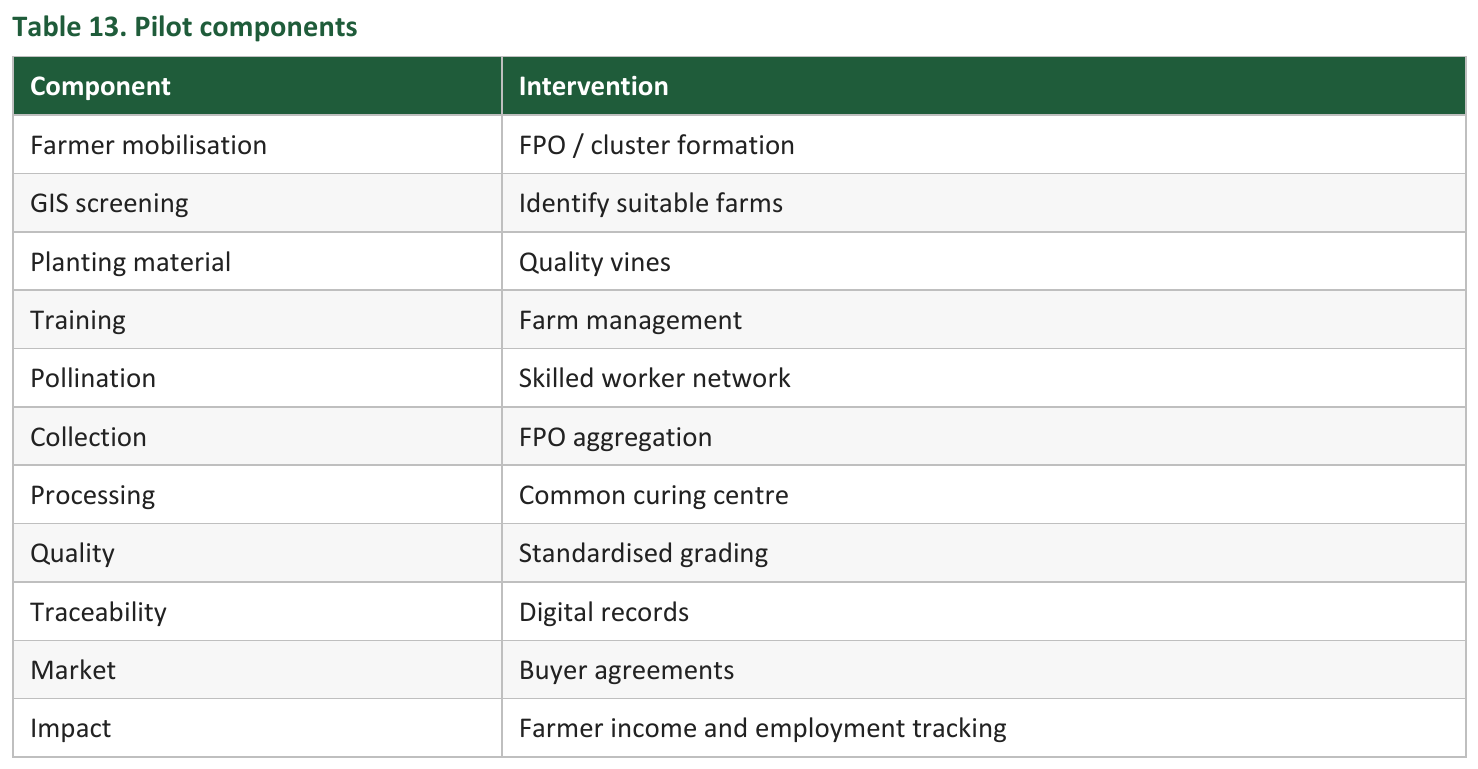
KPIs for the business case
The pilot should not be judged by tonnes alone.
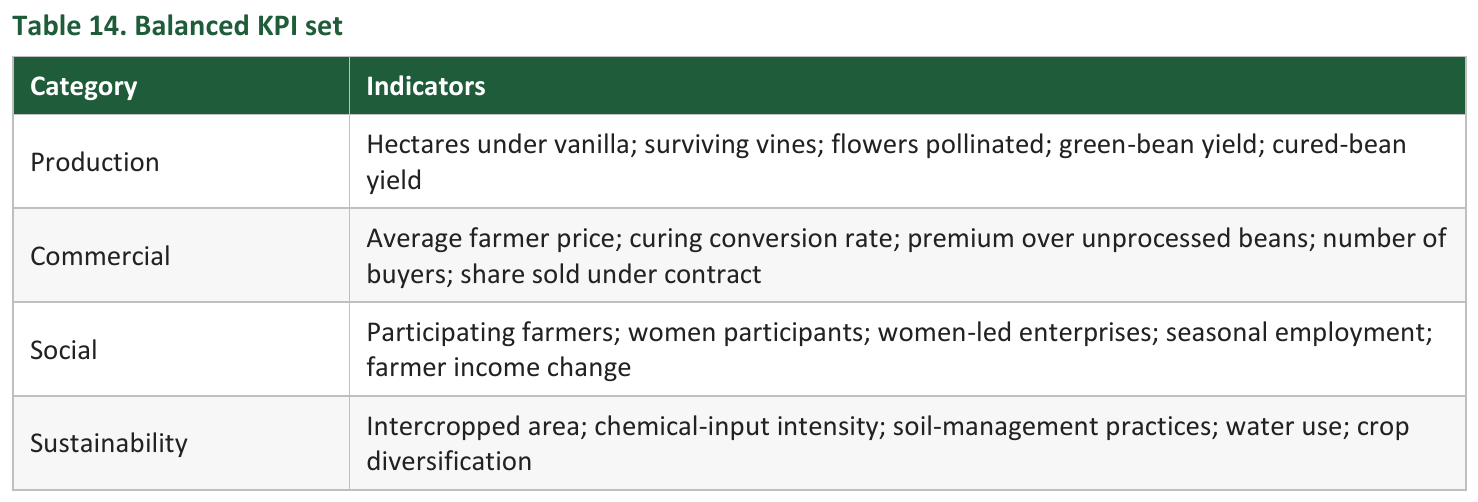
Go / no-go criteria before scaling
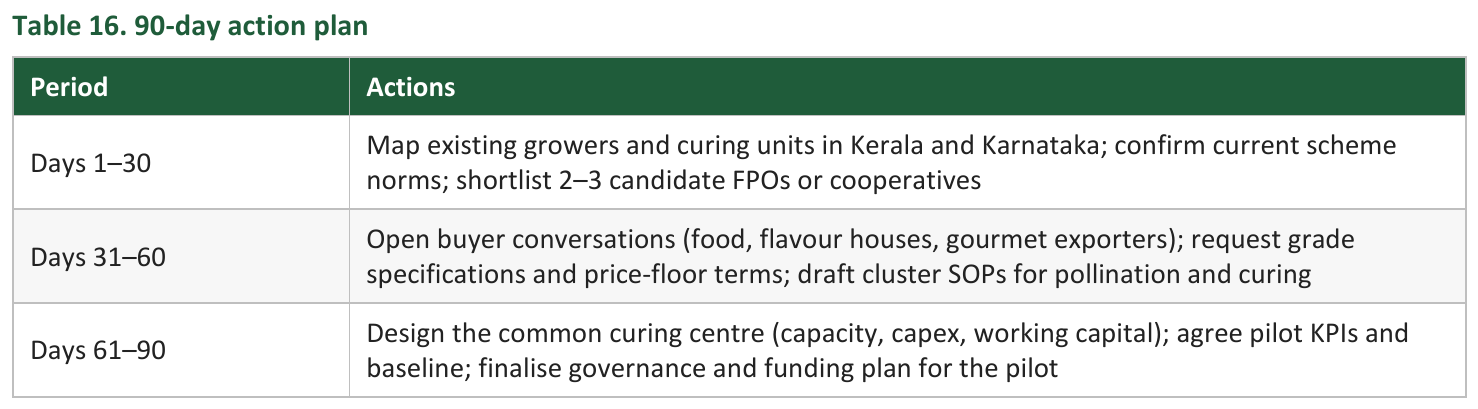
First 90 days
21. Final Strategic Assessment
India's vanilla industry is too small to compete with Madagascar or Indonesia on volume: about 29 tonnes in 2024–25 versus roughly 7,115 tonnes globally in 2024. But volume is not India's strongest opportunity.
International experience shows that vanilla is fundamentally a value-chain problem. Madagascar shows both the opportunity and the risk of scale. Indonesia shows the importance of diversified production and quality. Papua New Guinea shows how smallholder production can be strengthened through technical assistance, processing infrastructure and market linkages.
Verdict. Do not build an India vanilla industry around acreage alone. Build it around services, aggregation, processing and market access.
The most credible pathway is a cluster-based model starting in Kerala and Karnataka, followed by carefully selected pilots elsewhere. The goal is to move farmers from “growing vanilla” to “participating in a vanilla value chain”, which will decide whether Indian vanilla stays a niche crop or becomes a scalable premium-agriculture opportunity.
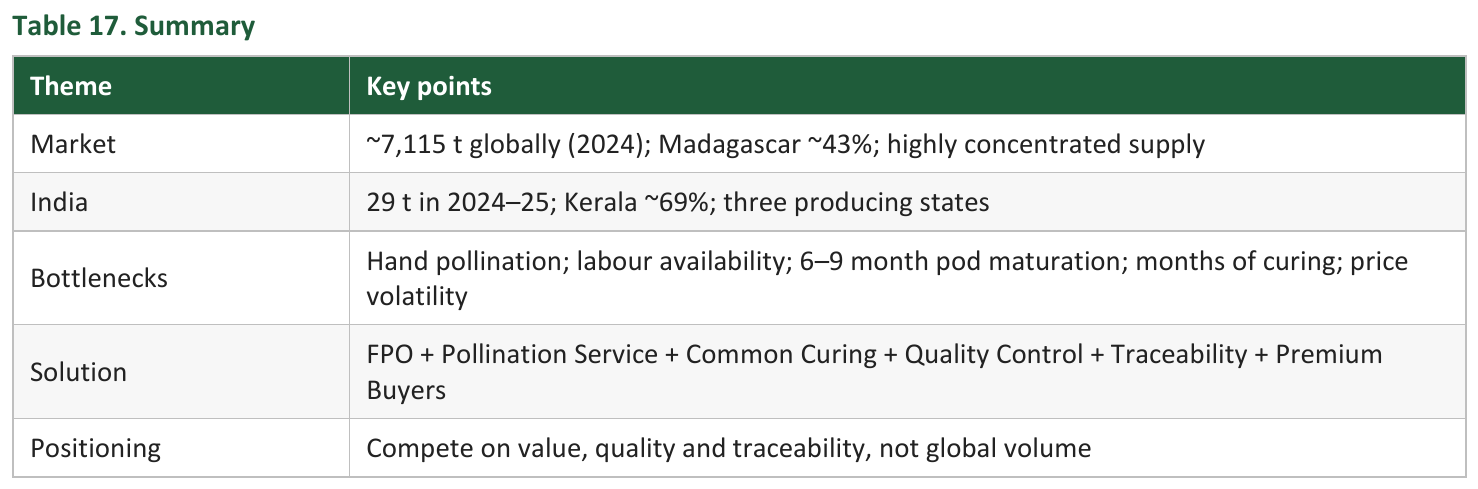
The opportunity on one page
References
FAOSTAT / UNdata. Vanilla, raw (Item Code 692). Food and Agriculture Organization.
Commodity Origins. Where does vanilla come from? Producers and exporters (FAOSTAT-derived 2024 data). commodityorigins.com/commodities/vanilla 3. Terra Cultiva. World Vanilla, raw production: country ranking and trends. terra-cultiva.com/en/product/vanilla-raw 4. Government of India, Dept. of Agriculture & Farmers Welfare. Area and Production of Horticulture Crops, 2024–25 Final Estimates.
ICAR–Indian Institute of Spices Research. Vanilla (Vanilla planifolia). spices.res.in/products/spices/vanilla.html 6. Spices Board India. Vanilla. indianspices.com/spice-catalog/vanilla.html 7. Tamil Nadu Agricultural University. Vanilla. agritech.tnau.ac.in/horticulture/horti_spice crops_vanilla.html 8. Tamil Nadu Agricultural University. FAQs: Spices & Plantations.
Kerala Agricultural University. Vanilla Harvesting and Curing. celkau.in/Crops/spices/vanilla/harvesting.php 10. FAO. Sustainable Vanilla Value Chain Development in the Greater Sepik Region, Papua New Guinea. fao.org 11. FAO / EU-STREIT PNG. Vanilla value chain. fao.org/in-action/eu-streit-png/value-chain-development/vanilla 12. FAO (2026). The Nine-Month Wait: Rebuilding Papua New Guinea's Vanilla Business. fao.org/papua-new-guinea 13. World Bank. Global Vanilla Market and its Prospects.
World Bank. Market vs. Government Failures: A Case Study of the Vanilla Sector in Madagascar.
Down To Earth. In a mess: South India's vanilla growers; Kerala farmers grow vanilla for profit. downtoearth.org.in 16. Tridge. Vanilla bean market overview and India/Madagascar price pages (2026). tridge.com 17. Expert Market Research. Vanilla price forecast and Q1 2026 trends. expertmarketresearch.com 18. FoodNavigator / BakeryandSnacks (2018). How to ensure stable supplies in a volatile vanilla market? (Mintec price data).
ConfectioneryNews (2017). Firmenich weathers the vanilla supply storm with diversified sourcing.
Lok Sabha / Rajya Sabha replies on vanilla cultivation support (1996, 2005, 2006, 2011). eparlib.sansad.in 21. Wikipedia. Vanilla (price history summary). en.wikipedia.org/wiki/Vanilla
Cover photo: "Vanilla beans" by Sunil Elias, CC BY-SA 3.0, via Wikimedia Commons.