Groundwater Consultancy
Haryana's Groundwater Crisis: Can Agriculture Grow Without Draining the Aquifer?
October 6, 2026

Business question: How can Haryana reduce groundwater extraction while maintaining agricultural productivity, farmer incomes and long-term water security?
1. Executive summary
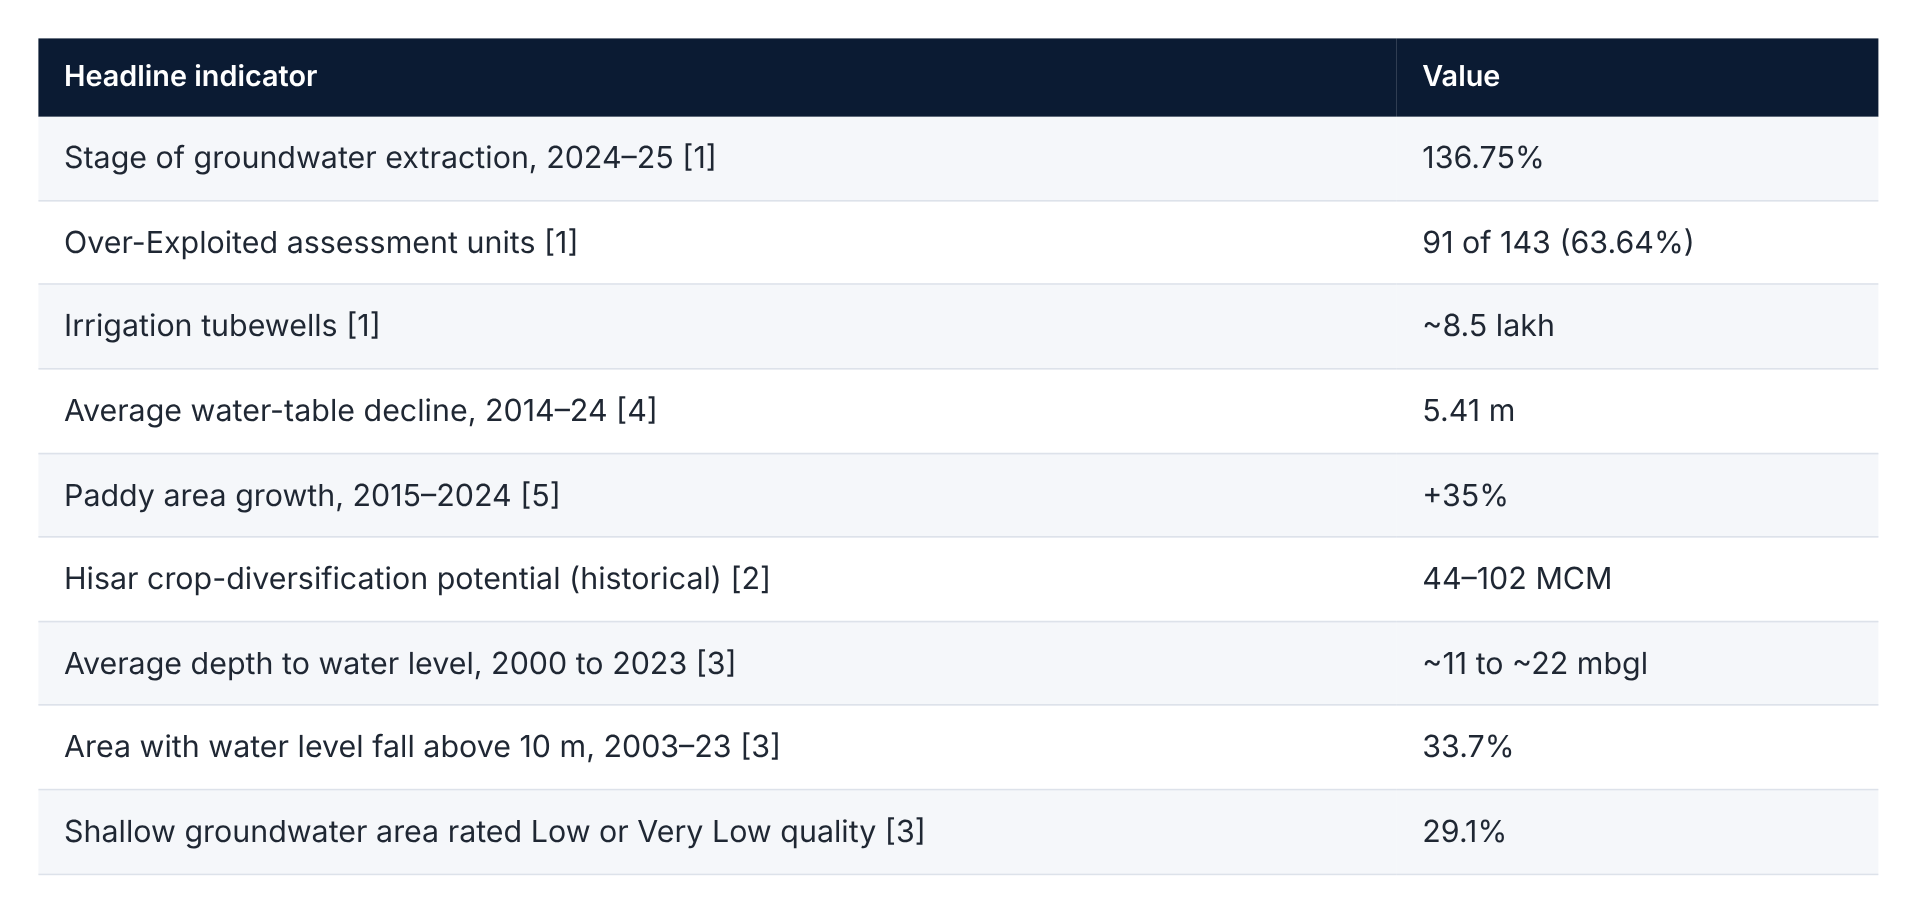
Haryana's groundwater challenge is no longer only a water-resource problem. It is an agricultural productivity, farmer-income, energy and long-term water-security problem. For 2024–25, annual groundwater recharge was estimated at 10.27 BCM and the annual extractable resource at 9.30 BCM. Reported extraction was 12.72 BCM, a Stage of Groundwater Extraction of 136.75%.[1] Of 143 assessment units, 91 are Over-Exploited, 6 Critical, 15 Semi-Critical and only 31 Safe.[1]
Agriculture is the central driver. Haryana has about 3.5 million ha of cultivated area, of which 1.121 million ha are tubewell-irrigated, supported by about 8.5 lakh irrigation tubewells.[1] Press evidence supports the picture: the average water table fell 5.41 m between 2014 and 2024, and 88 of 143 blocks were Over-Exploited in the 2024 assessment.[4] Paddy area grew by more than 35% over 2015–2024 despite official diversification drives.[5] Newspaper reports are used only as supporting evidence; CGWB and the Haryana Water Resources Atlas (HWRA) are the primary statistical sources.
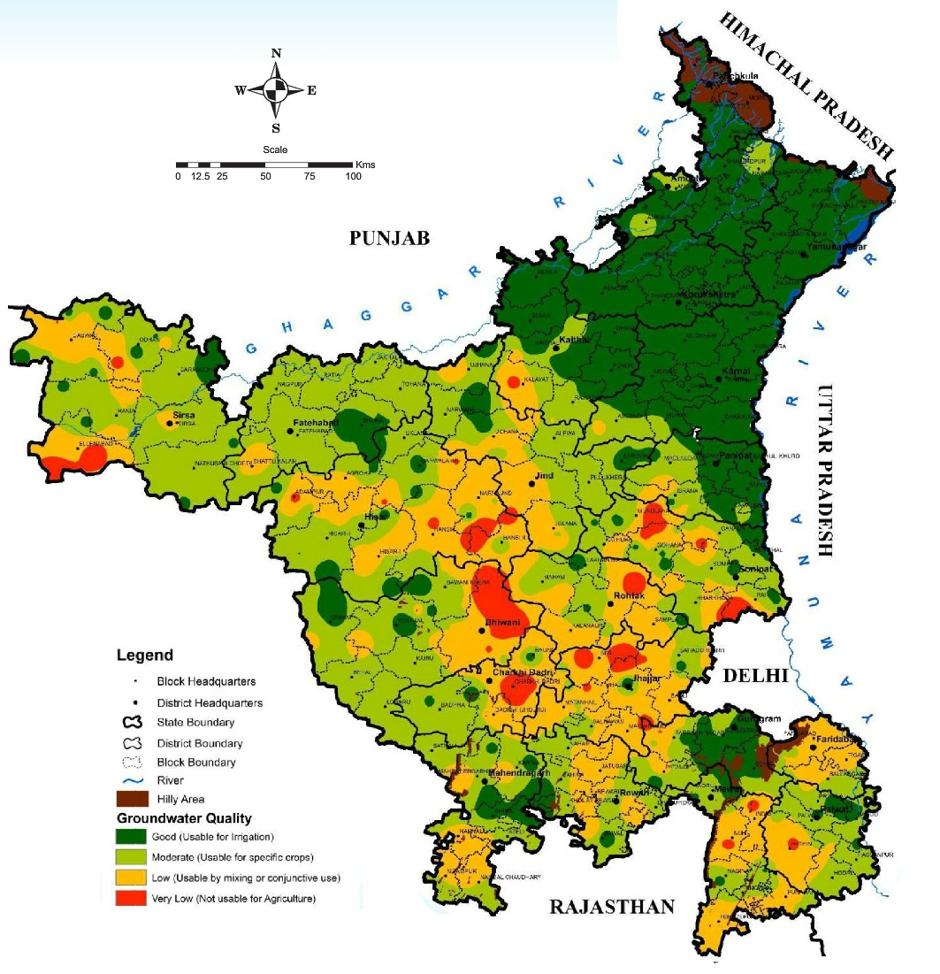
Figure 1. Ground Water Quality in Shallow Aquifers, WQI 2023, HARSAC / GIS based
The Haryana Water Resources Atlas 2025 adds spatial detail. The average water table deepened from about 11 to 22 m below ground between 2000 and 2023; pre-monsoon water levels fell across 75% of the state's area between 2003 and 2023 (34% by more than 10 m); and 29% of shallow groundwater area is rated Low or Very Low quality. Depletion and poor quality are concentrated in different districts, so interventions must be matched to place.[3]
This case proposes a demand-management model: crop diversification, Direct Seeded Rice (DSR) and efficient irrigation, canal–groundwater conjunctive use, targeted artificial recharge, wastewater reuse, GIS-based spatial targeting and incentives linked to measured water savings. The objective is not simply less groundwater. It is more agricultural output and farmer security per unit of groundwater used.
2. The groundwater balance
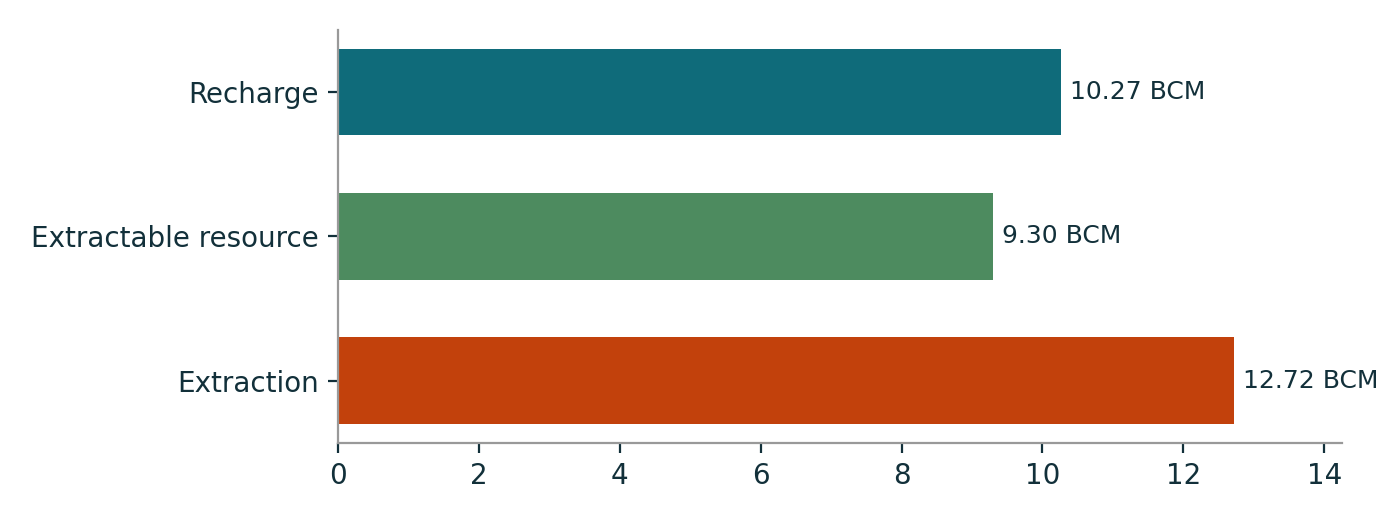
Figure 2. Haryana groundwater balance, 2024–25 (BCM). Extraction is about 37% above the annual extractable resource. Source: CGWB (2025) [1].
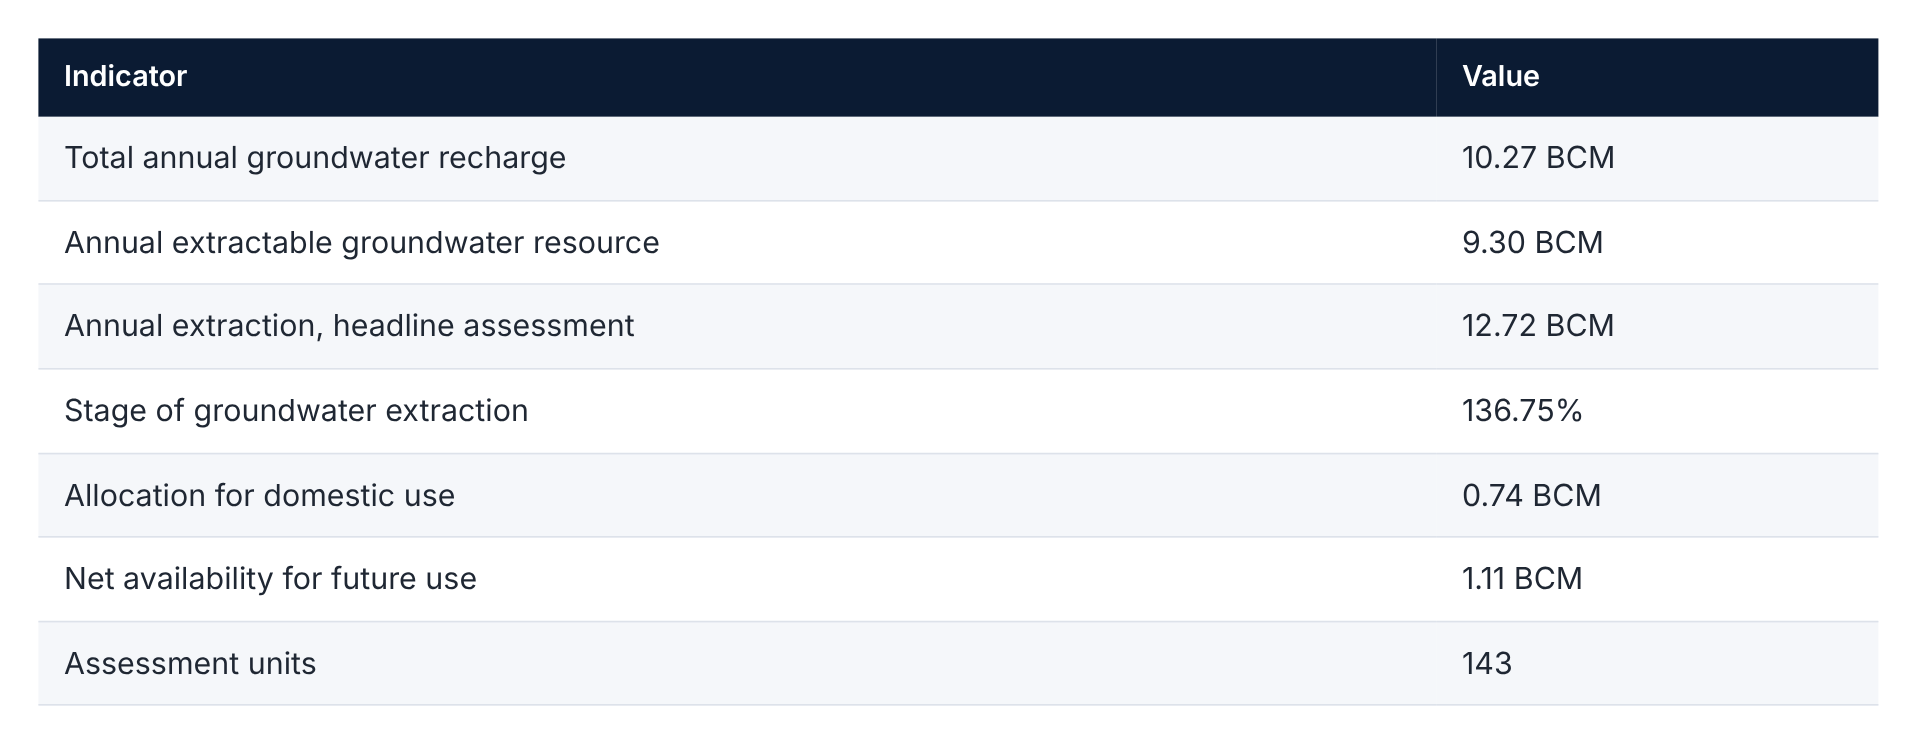
Data flag. The report's state table and "At a Glance" section give 12.72 BCM extraction (1,271,939.84 ham), the figure used throughout this case. Its detailed temporal table gives 1,371,952.39 ham (about 13.72 BCM), and the committee meeting summary reports 13.71 BCM, with the same 136.75% stage shown. These figures are not reconciled here; raise the gap with CGWB before client use.[1]
3. Stress is widespread and persistent
Nearly two-thirds of assessment units are Over-Exploited, and 112 of 143 (78.3%) fall outside the Safe category.[1] Several "Safe" units have poor, largely saline groundwater, so a safe quantity rating does not guarantee usable water.[1]
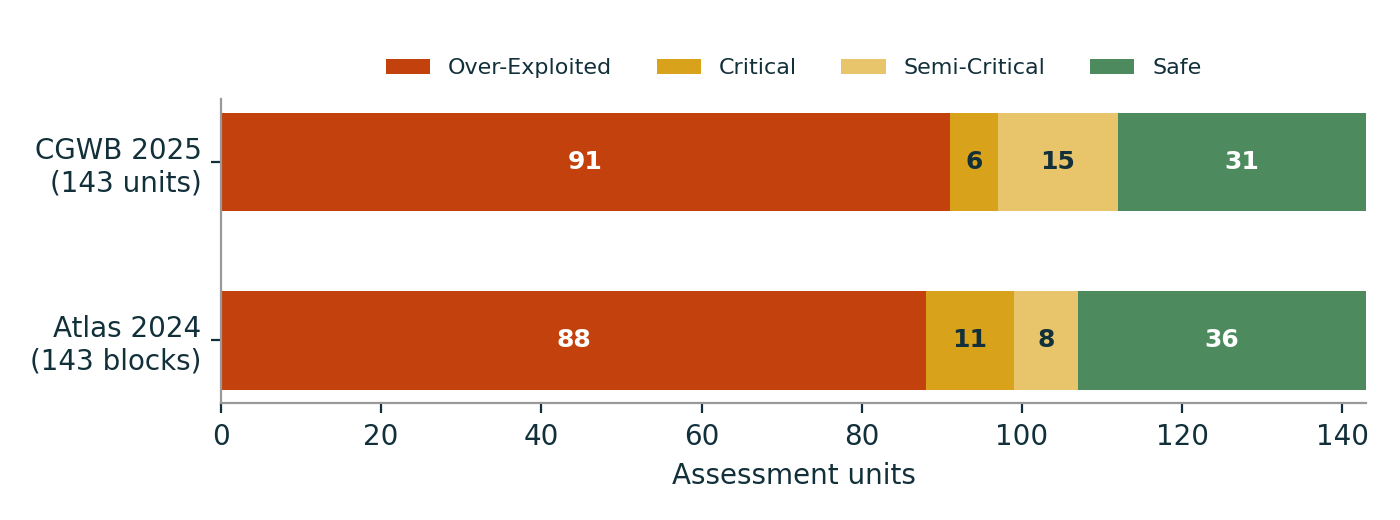
Figure 3. Assessment units by category: CGWB 2025 versus Atlas 2024 block classification (n = 143 each). Sources: CGWB (2025) [1]; HWRA (2025), Figure 45 [3].
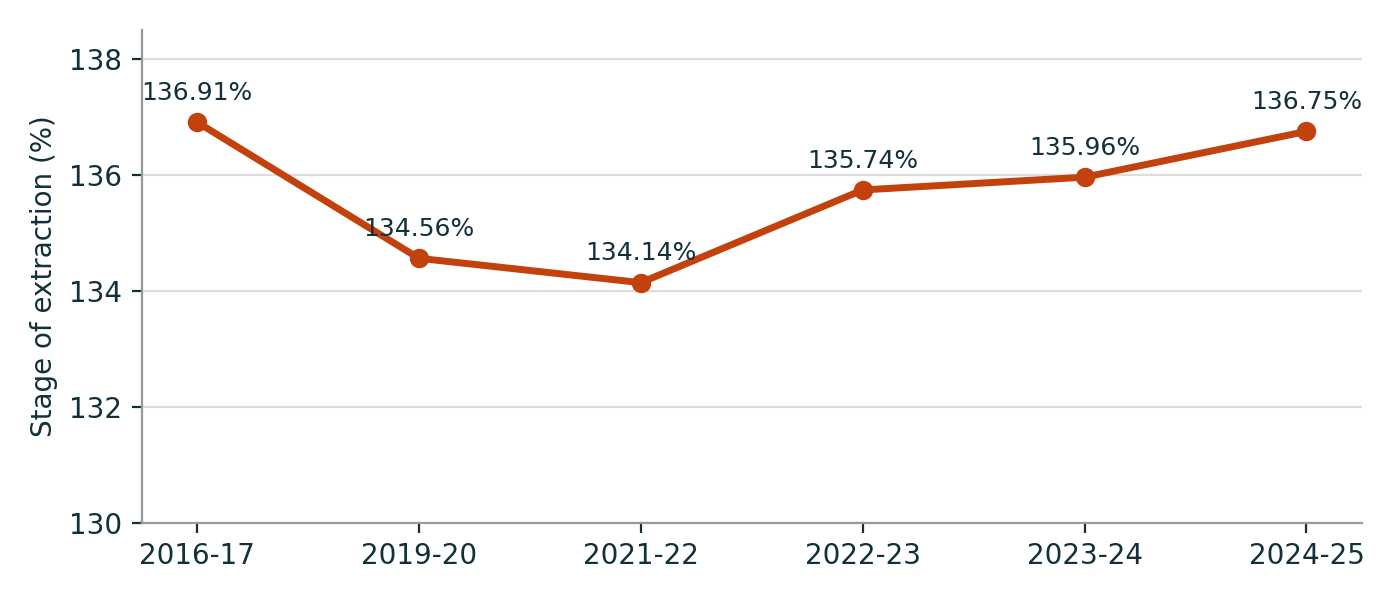
Figure 4. Stage of groundwater extraction, 2016–17 to 2024–25. The vertical axis starts at 130% to show small changes. Extraction stayed above 134% in every year shown. Source: CGWB (2025), Table 20 [1].
Independent evidence
In March 2025 the Indian Express reported a 5.41 m average water-table decline from 2014 to 2024, with Ambala the most affected district, and 88 of 143 blocks Over-Exploited in the 2024 assessment (against 91 units in 2025).[4] The state described depletion in freshwater zones as serious and named artificial recharge and conservation as priorities. HWRA's long-term analysis likewise shows widespread declining water levels where agricultural and human extraction is high.[3]
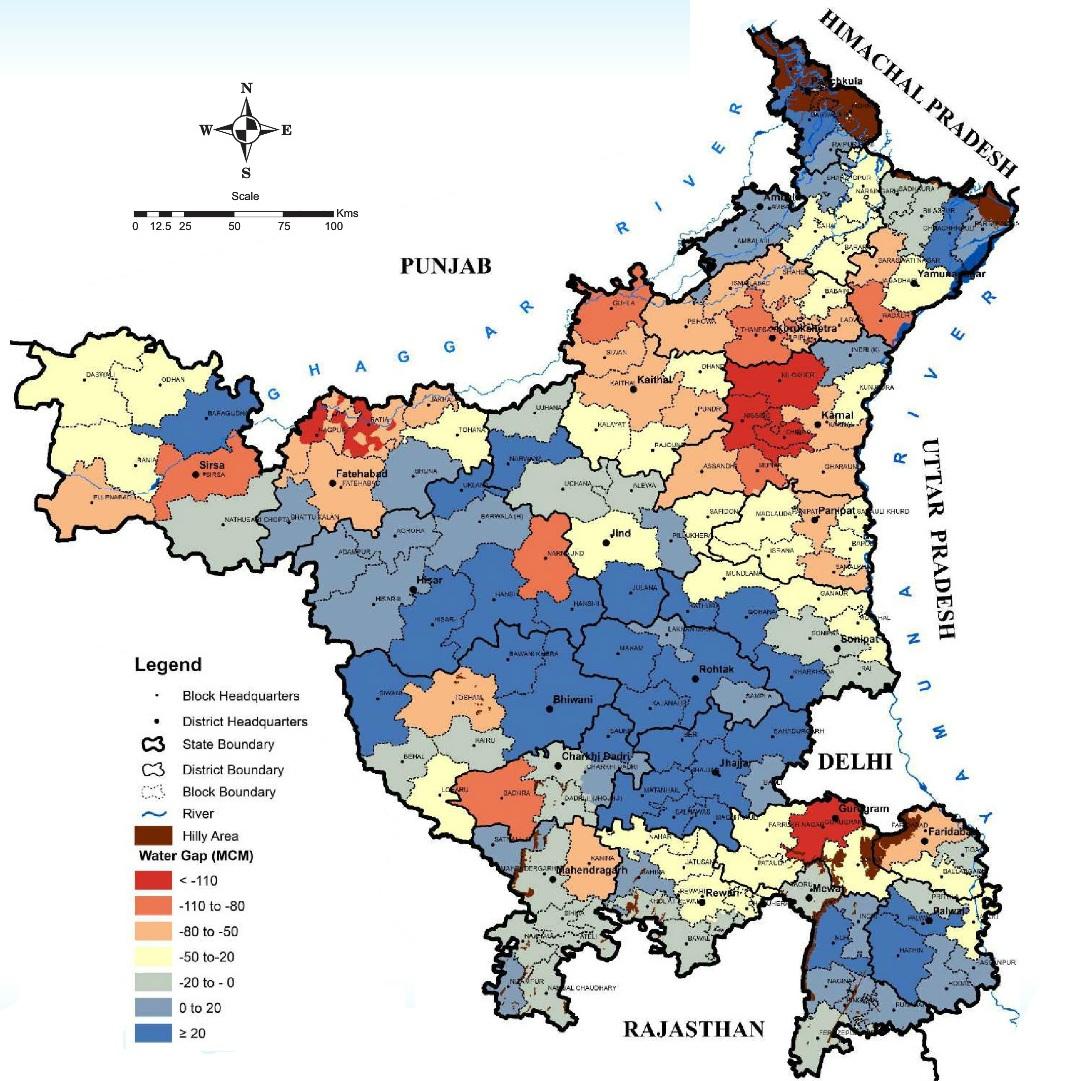
Figure 5. Block-wise Water Stress / Gap 2023, in MCM, CGWB, India
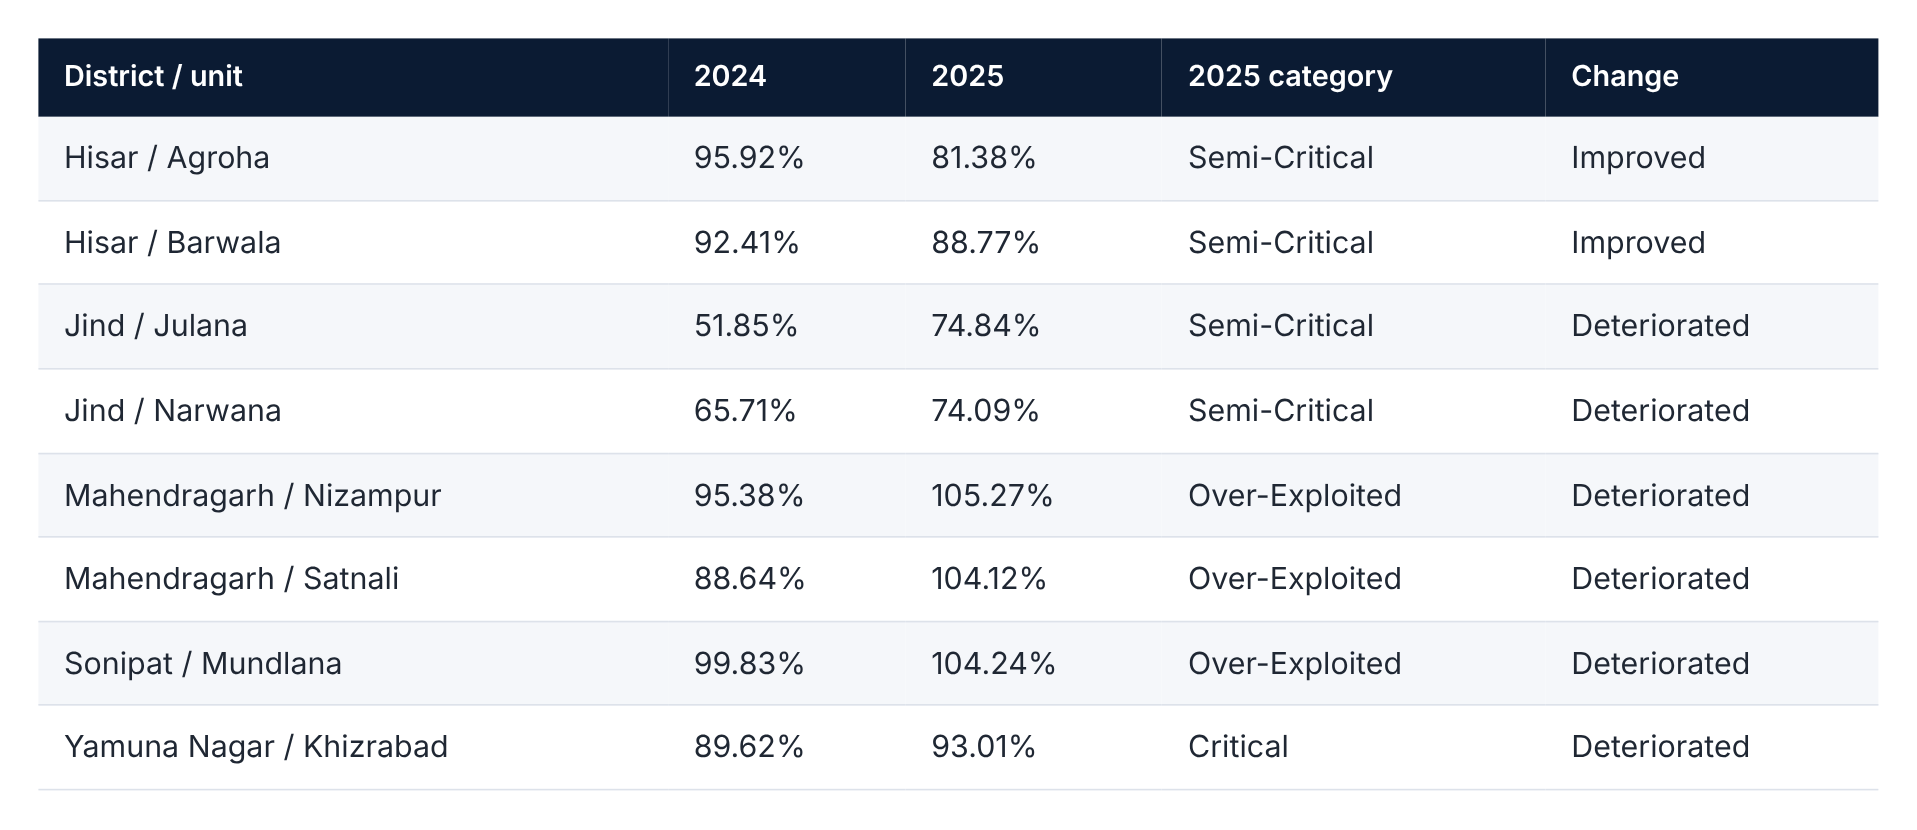
Table 1. Assessment-unit stage of extraction, 2024 to 2025. Source: CGWB (2025) [1].
Over-exploitation is dominant across northern, western and southern Haryana, while parts of the extreme north, north-east and south-east fare better and some central areas face waterlogging and poor quality.[1] Block-level monitoring matters more than district averages.
4. Spatial evidence from the Haryana Water Resources Atlas 2025
The Atlas, produced by HWRA with HARSAC from Groundwater Cell, CGWB and other agency data, adds district-level maps and tables that the CGWB state summary does not provide.[3] The original maps can be viewed in the Atlas itself. The tile maps below are our schematic redrawings of Atlas tables: each tile is one district, placed roughly by position and not to scale.[3]


Figure 6. Pre-monsoon Comparison of Water Level 2003 and 2013, 2023 and 2024, GWC, Haryana
The water table has deepened by about 11 metres since 2000
The Atlas hydrograph shows the average depth to water rising from about 11 m below ground level (mbgl) in 2000 to about 22 mbgl in 2023, with a faster fall before the monsoon. Rainfall explains year-to-year swings but not the long-term fall: the wettest year was 2008 (about 689 mm), the driest 2006 (about 354 mm), and the rainfall trend is only slightly downward.[3]
Atlas Table 36 (June 2003 to June 2023) shows pre-monsoon water levels fell across 75.3% of the state's area (about 4.4 million ha). The fall exceeded 5 m across 49.4% of the area, 10 m across 33.7% and 20 m across 14.3%, while 24.7% of the area saw a rise.[3] These shares are our calculations from the Atlas table.

Figure 7. Change in pre-monsoon water level by class, June 2003 to June 2023 (% of total geographical area). Source: HWRA (2025), Table 36; our calculations [3].
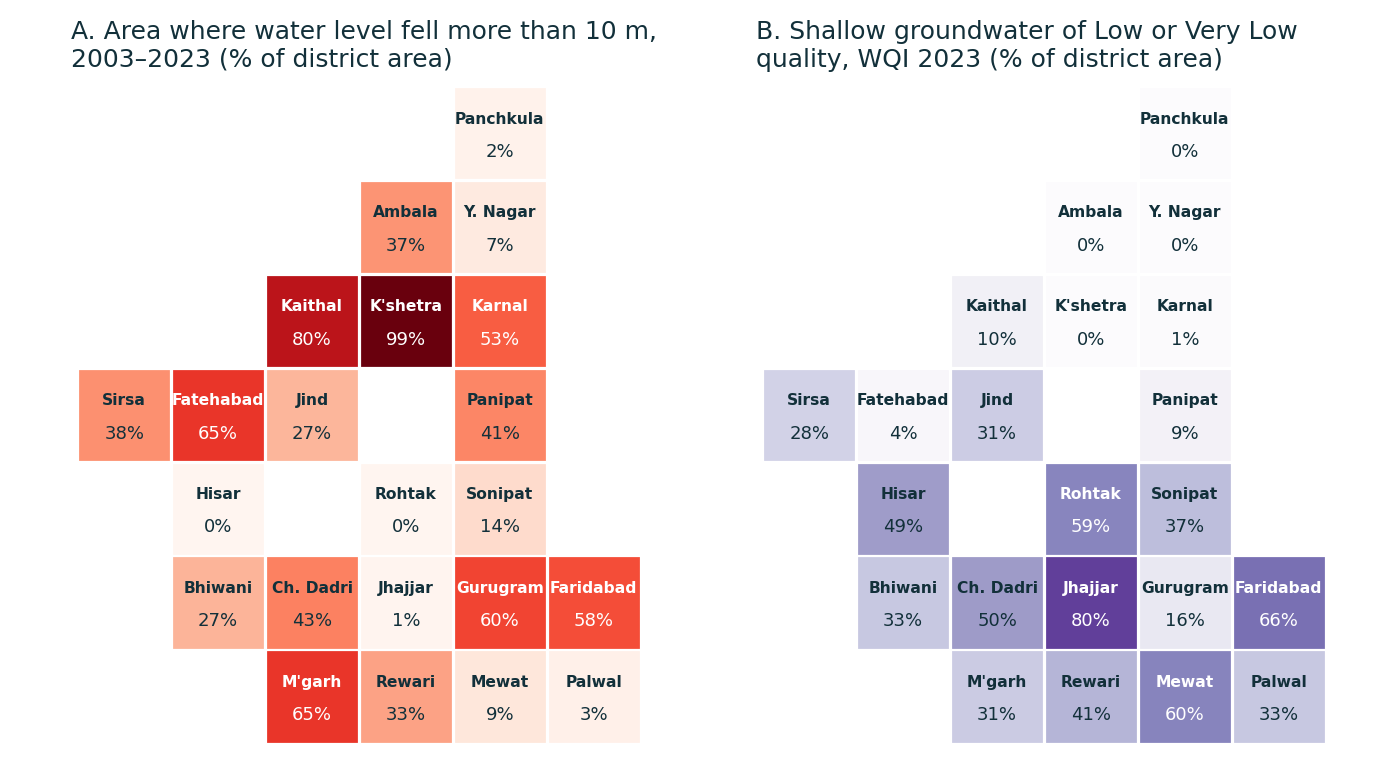
Figure 8. Schematic district tile maps. A: share of area where the water level fell more than 10 m, 2003–2023. B: share of shallow groundwater area rated Low or Very Low quality (WQI 2023). Source: HWRA (2025), Tables 36 and 39; our calculations and layout [3].
Depletion is concentrated. The fall exceeded 10 m across 99.3% of Kurukshetra, 80.1% of Kaithal, 64.7% of both Fatehabad and Mahendragarh, 59.8% of Gurugram, 57.8% of Faridabad and 53.2% of Karnal. The Atlas links severe depletion in the Ghaggar belt to agricultural and human extraction and heavy runoff in the rains.[3] By contrast, central Hisar, Rohtak and parts of Bhiwani show rising levels, so Hisar as a whole shows a fall in only 24.6% of its area and a fall above 10 m in just 0.2%. District averages like these can hide the block-level stress CGWB records in Narnaud and the Hansi blocks.[2][3]
Waterlogging and depletion coexist
The Atlas finds water levels at or above 3 mbgl (potentially or severely waterlogged) mainly in Jhajjar, Rohtak, Bhiwani, Jind, Hisar, Ambala and parts of Palwal. Severely waterlogged coverage was larger in 2013 than in 2023, which the Atlas reads as evidence that drainage management has worked, but potentially waterlogged area is larger after the monsoon than before it.[3] At the same time, severely water-stressed area has grown steadily over 20 years. Mahendragarh, Kaithal, Kurukshetra, Sirsa, Fatehabad and Bhiwani are the most affected. Gurugram moved from potentially stressed in 2003 to severely stressed in 2023 despite its Yamuna location, and a new severely stressed patch has appeared along the Yamuna across Panipat and Sonipat.[3] The Atlas assigns conservation strategies to Rewari, Panipat, Sonipat, Faridabad, Karnal and Mewat.[3]
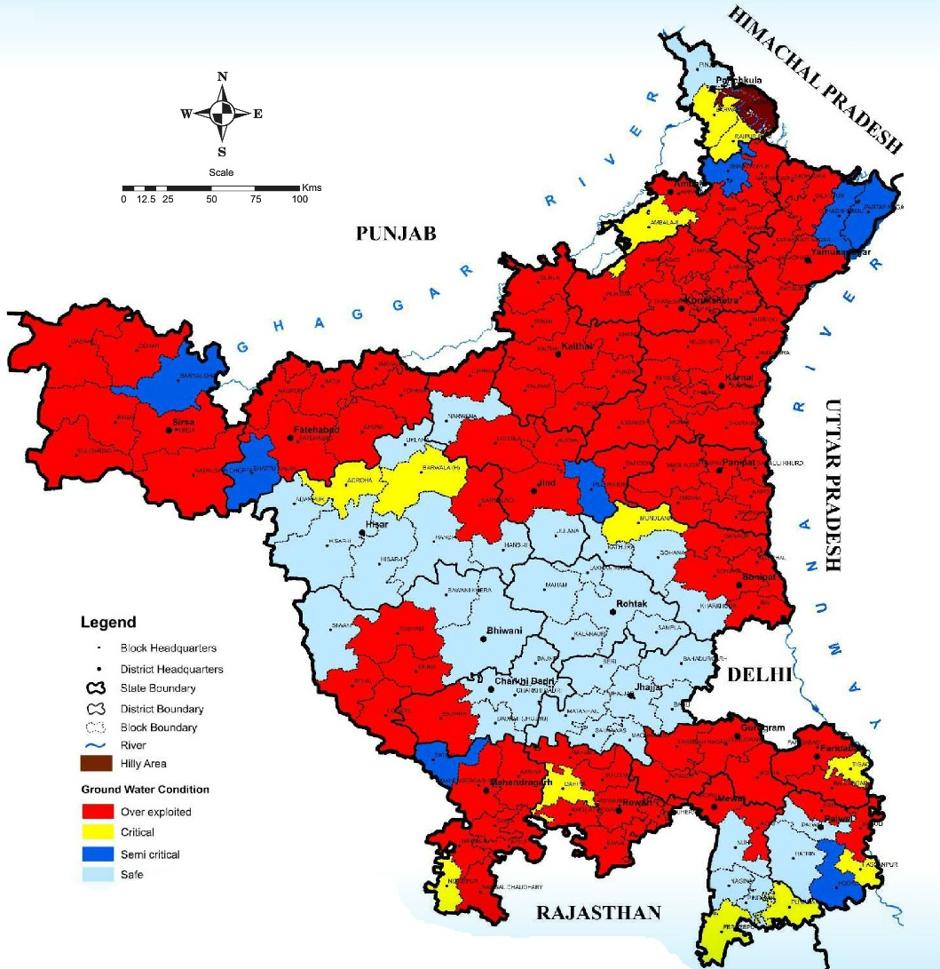
Figure 9. Stage of Ground Water Extraction Categorization 2024, GWC, Haryana
Block categories: 88 of 143 over-exploited in 2024
The Atlas classes the 143 blocks for 2024 as 36 Safe (stage at or below 70%), 8 Semi-Critical (above 70% to 90%), 11 Critical (above 90% to 100%) and 88 Over-Exploited (above 100%). Over-Exploited blocks cover 61% of the state's area, found in parts of Sirsa, Ambala, Kurukshetra, Gurugram, Fatehabad, Faridabad, Kaithal, Karnal, Yamunanagar, Panipat, Sonipat, Mahendragarh, Jind, Charkhi Dadri, Bhiwani and Rewari, while central Haryana is the safe zone.[3] Against CGWB's 2025 count (91 Over-Exploited, 31 Safe), Over-Exploited units rose by three and Safe units fell by five (see Figure 3 in Section 3). The two come from different assessment years, so the comparison is indicative.[1][3]
Water quality is a second, mapped constraint
The Atlas Water Quality Index (HARSAC, 2023) rates shallow groundwater across 28.6% of the state's area as Good (usable for irrigation), 42.2% Moderate (suitable for specific crops), 26.0% Low (usable only by mixing or conjunctive use) and 3.1% Very Low (not usable for agriculture), so 29.1% of the area is Low or Very Low.[3] The north-east (Panchkula, Ambala, Yamunanagar, Kurukshetra, Karnal, parts of Panipat and Kaithal) is mostly Good. The west (Sirsa, Fatehabad and parts of Bhiwani, Hisar, Mahendragarh and Jind) is mostly Moderate. Low quality dominates parts of central and southern Haryana, and Very Low patches occur in parts of Bhiwani, Charkhi Dadri, Jhajjar, Rohtak, Hisar and Sirsa.[3] The Low or Very Low share is highest in Jhajjar (80.5%), Faridabad (66.1%), Mewat (59.7%), Rohtak (59.1%), Charkhi Dadri (49.9%) and Hisar (49.2%).
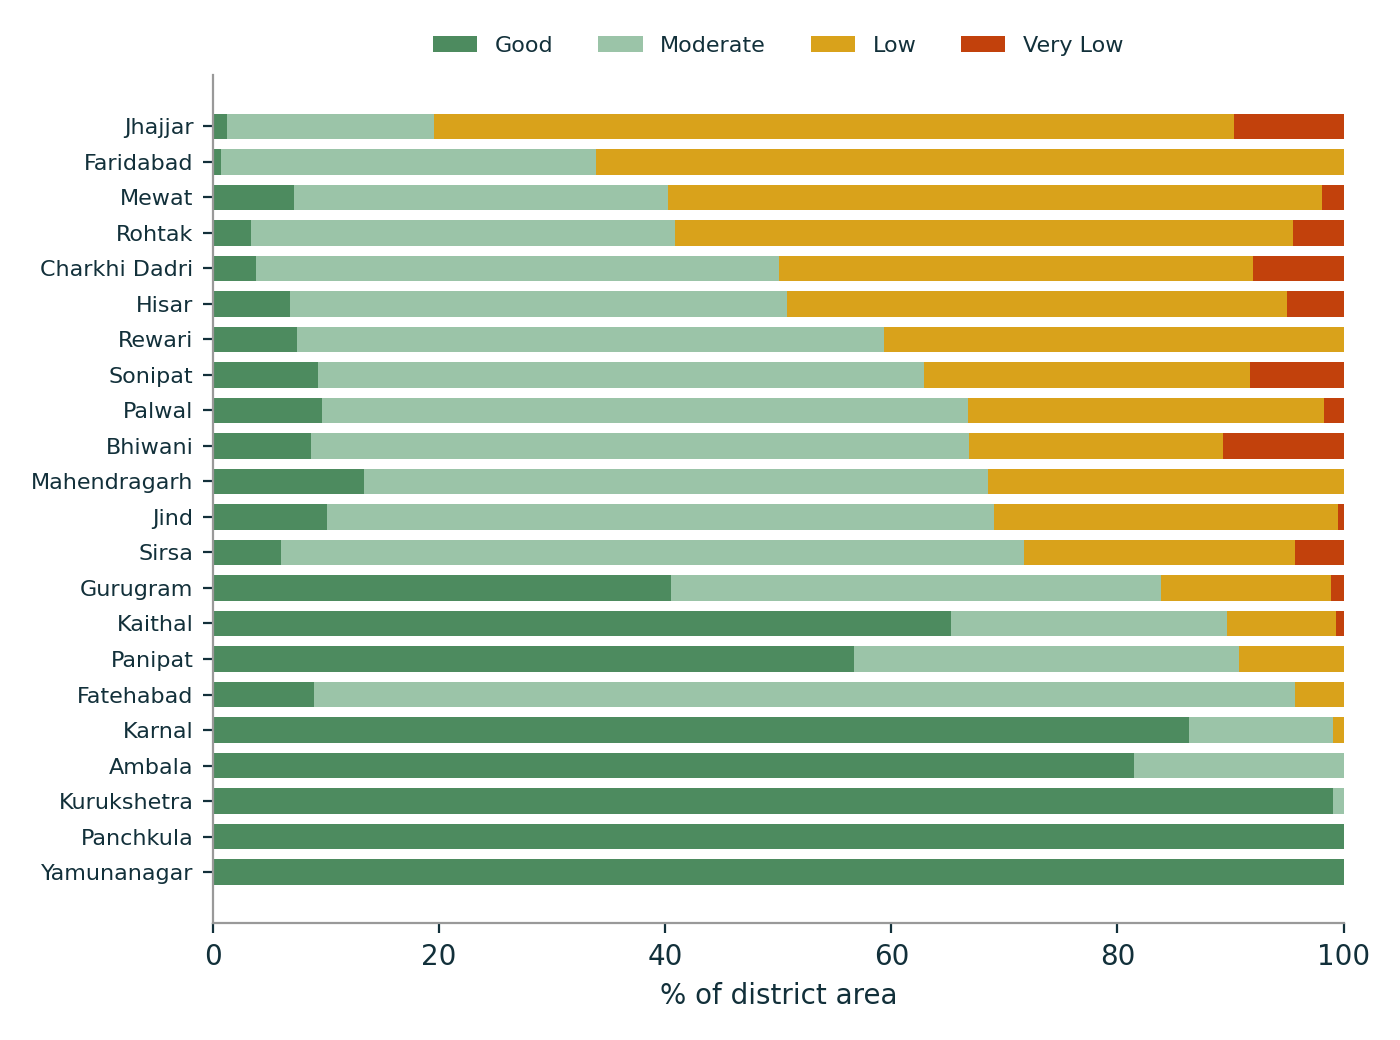
Figure 10. Shallow groundwater quality by district, WQI 2023 (% of district area), sorted by Low plus Very Low share. Source: HWRA (2025), Table 39; our calculations [3].
Overlay: two different groundwater problems
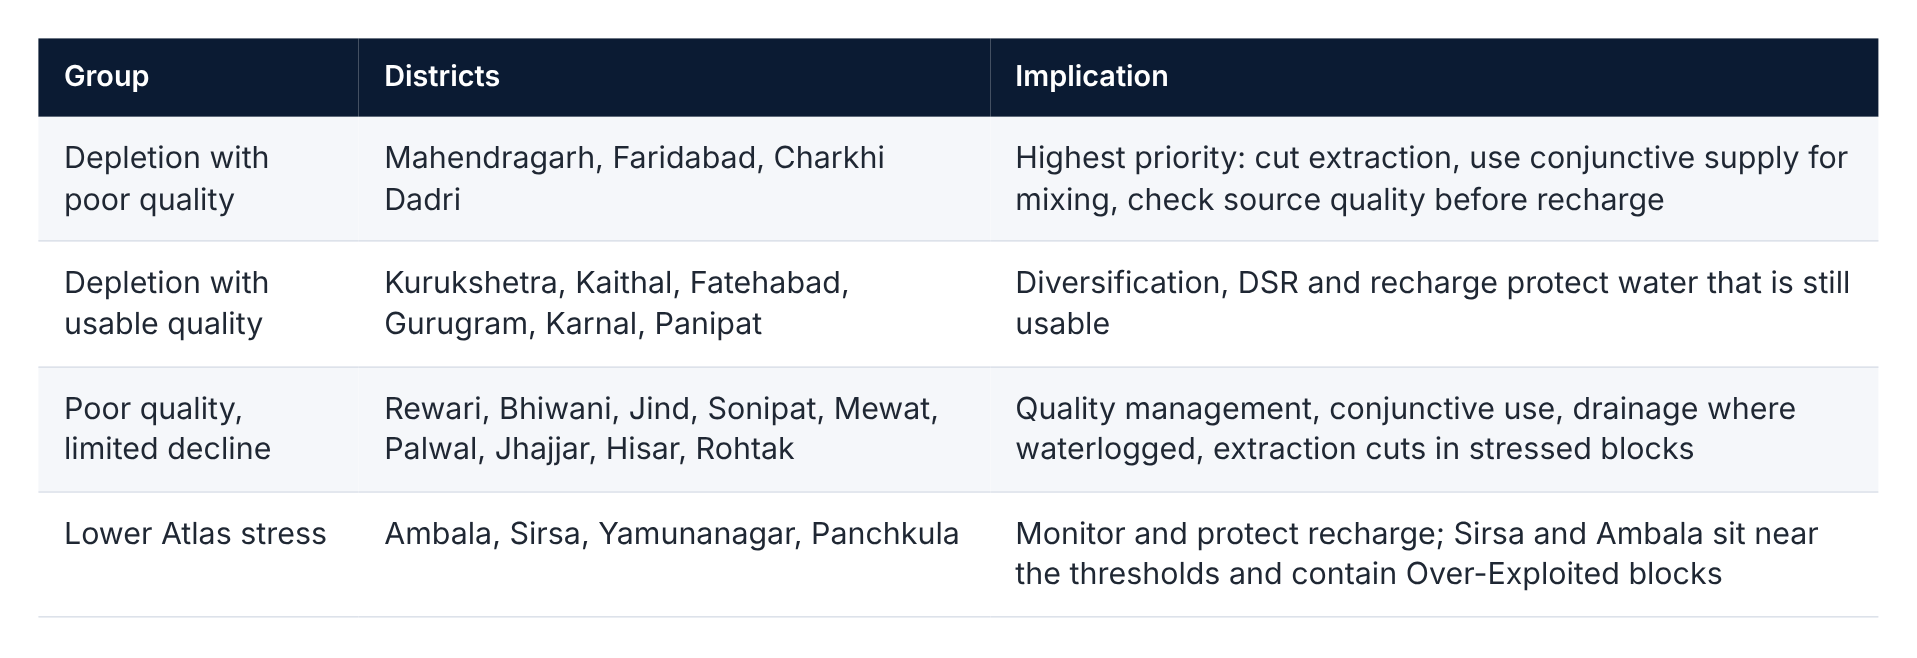
Overlaying depletion and quality separates the districts into four groups. The thresholds here are illustrative (a fall above 10 m across at least 40% of the district; Low or Very Low quality across at least 30%), and each point is a district average.

Figure 11. District overlay of long-term depletion and poor groundwater quality. Dashed lines mark the illustrative thresholds. Source: HWRA (2025), Tables 36 and 39; our calculations [3].
5. Why agriculture is the lever
Irrigation dominates groundwater use; domestic and industrial draft are far smaller.[1] About 32% of the cultivated area (1.121 million ha of about 3.5 million ha) is tubewell-irrigated.[1] Four drivers interact:
Water-intensive crops, notably paddy.
Tubewell dependence, especially where canal supply is uneven.
Rainfall variability, which raises pumping in dry years and lowered the 2025 extractable resource.
Rising costs: deeper water levels, higher energy use and well failures squeeze farm margins.[1]
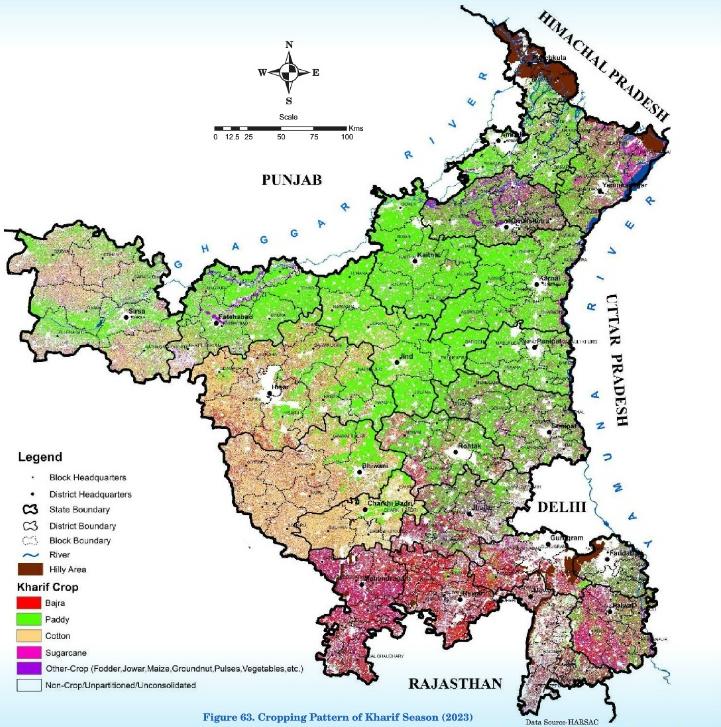

Figure 12. Cropping Pattern of Kharif and Rabi Season 2023, HARSAC / GIS based
The paddy paradox
Paddy offers assured procurement, predictable returns, established markets and familiar practice. The Tribune reports that agriculture uses about 87% of Haryana's water, with over half of that from groundwater.[6] Paddy area nonetheless rose from 13.53 lakh ha in 2015 to 18.37 lakh ha in 2024.[5] A technically sound intervention fails if it cannot compete with existing economic incentives, so diversification is a farmer-income and market-design problem as well as a water one.
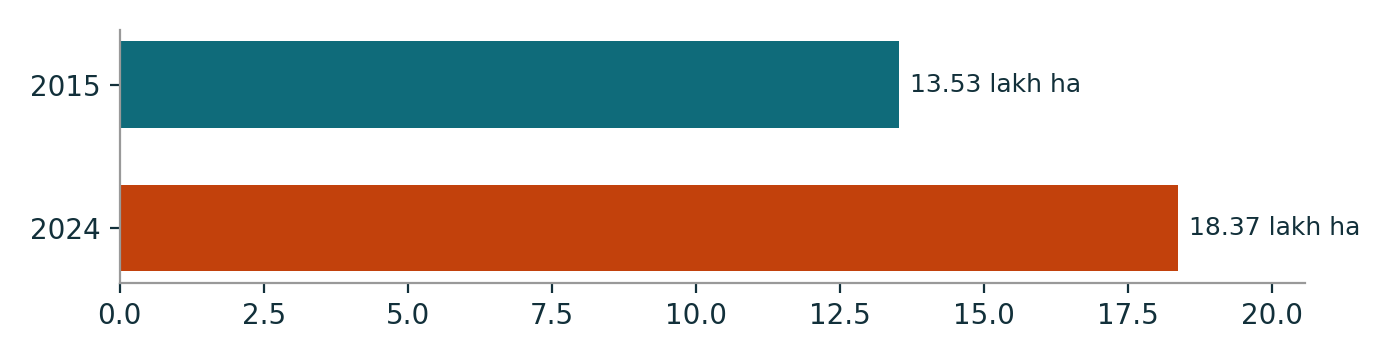
Figure 13. Paddy area in Haryana (lakh ha), a rise of 4.84 lakh ha (+35.8%). Source: Indian Express (2025) [5].
6. Hisar: a district deep-dive
CGWB classed Hisar as Over-Exploited at 112% development, with 783.0 MCM of draft against 701.78 MCM available and a future irrigation balance of –84.22 MCM.[2] The study is from 2017, with data from roughly 2013–2016, so these figures show historical stress, not the current position.
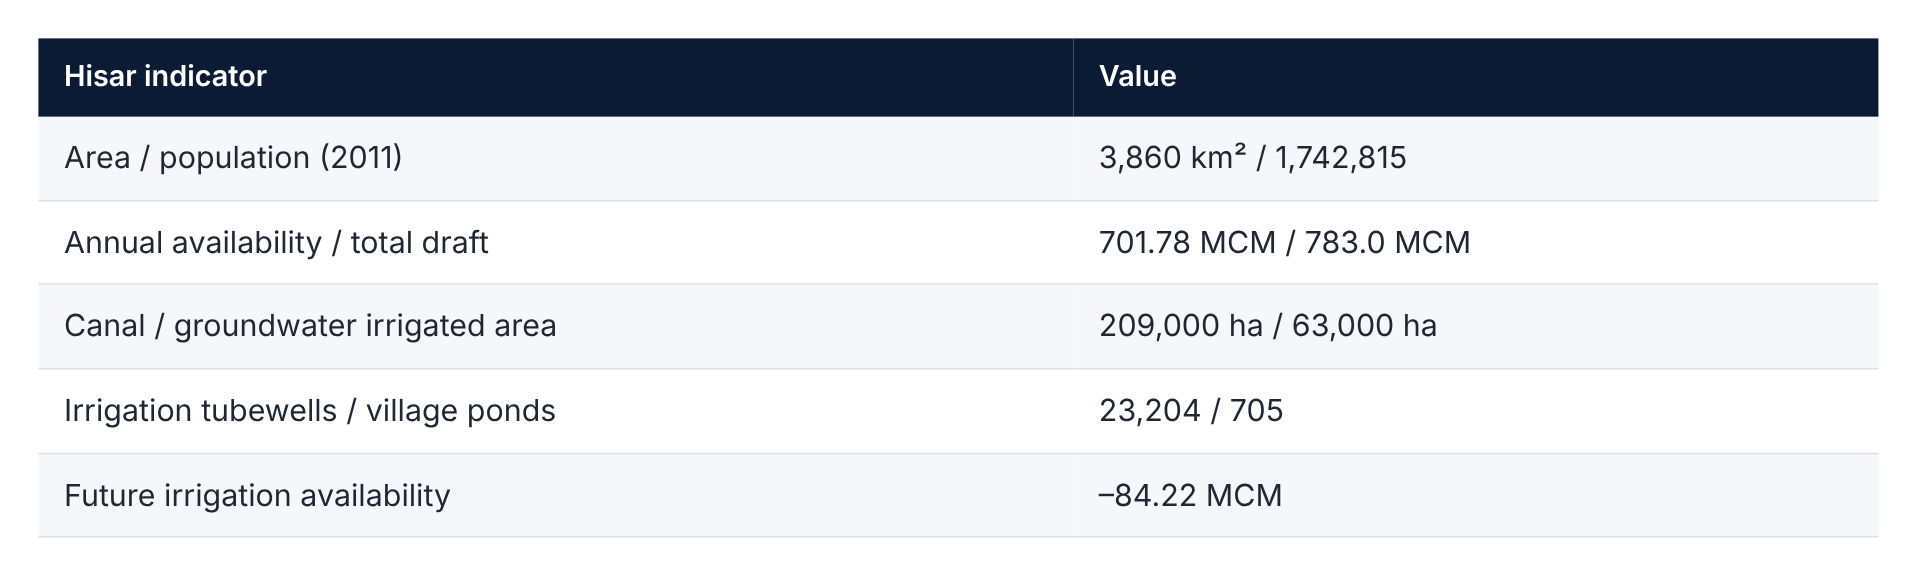
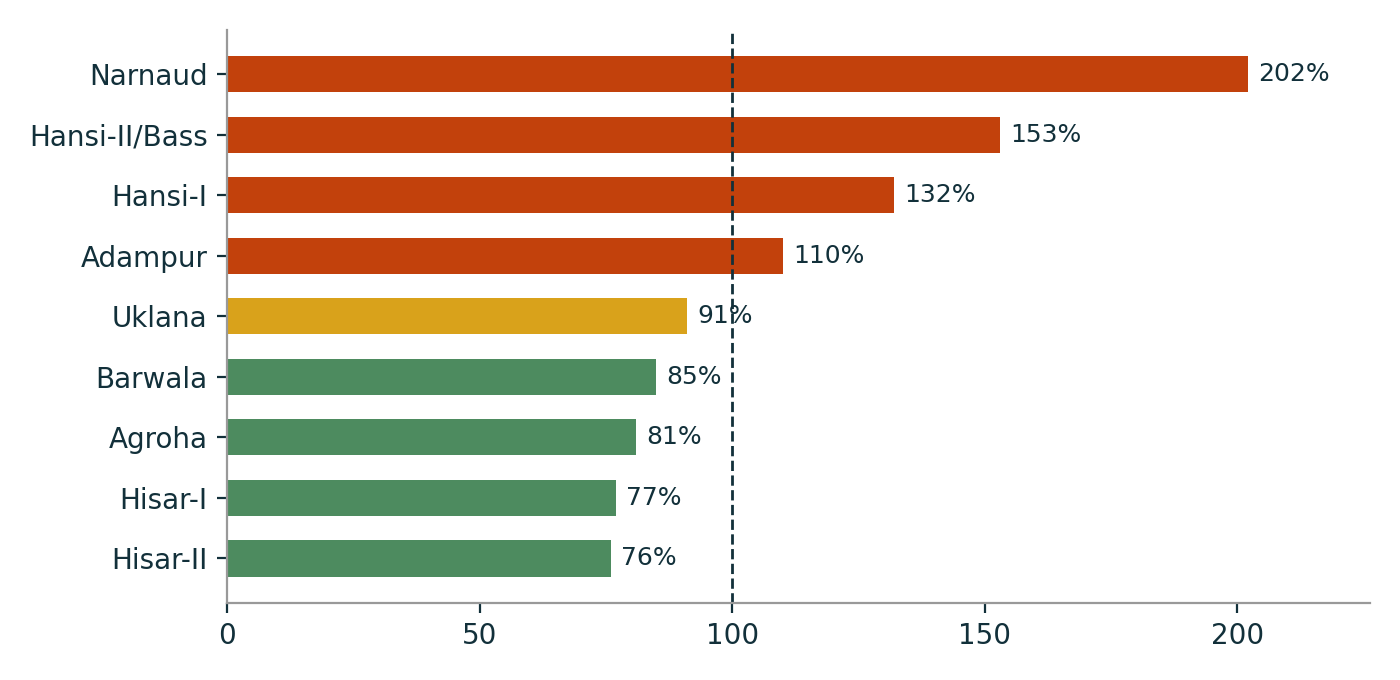
Figure 14. Stage of groundwater development by Hisar block (%). The dashed line marks 100%. Source: CGWB Hisar study, assessment year 2013 [2].
Narnaud draws 185.76 MCM against 91.98 MCM available (202%), while Hisar-II draws 63.21 MCM against 82.72 MCM (76%). Uniform district-wide measures would be inefficient: stressed blocks need demand reduction and extraction control, safer blocks monitoring and recharge protection.[2]
Quality compounds quantity
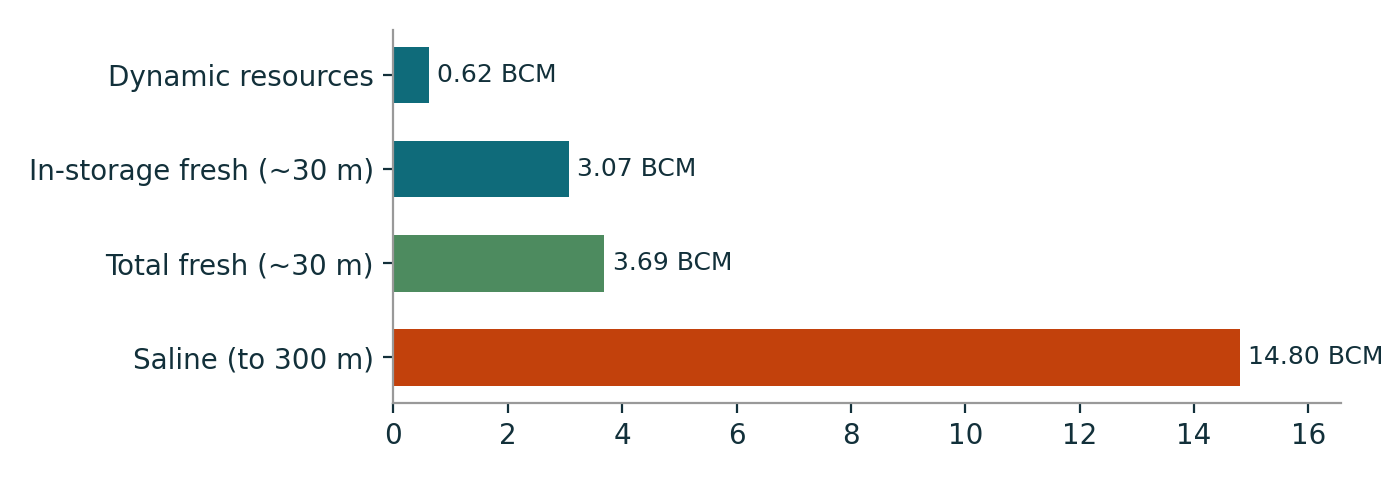
Figure 15. Hisar aquifer resources to 300 m (BCM). Saline water outweighs fresh water roughly four to one. Source: CGWB Hisar study [2].
Fresh water is mostly confined to the upper aquifer, so drilling deeper is not a fix. Sampled quality (historical baseline): 71% of samples had EC below 3,000 µS/cm and 29% were saline; 18% exceeded 45 mg/L nitrate (maximum 609 mg/L); 29% exceeded 1.5 mg/L fluoride (maximum 4.04 mg/L); only about 43% met the selected potable criteria.[2] The 2025 state assessment also flags salinity, fluoride and uranium in several districts.[1] Even where water is physically present, it may not be usable.
The Atlas confirms this at district scale. Hisar's shallow groundwater is 6.8% Good, 43.9% Moderate, 44.2% Low and 5.0% Very Low, so 49.2% of its area is Low or Very Low, and Hisar is also listed among districts with waterlogged pockets.[3] Hisar's problem is therefore quality-constrained and block-specific rather than uniform depletion.
7. The intervention portfolio
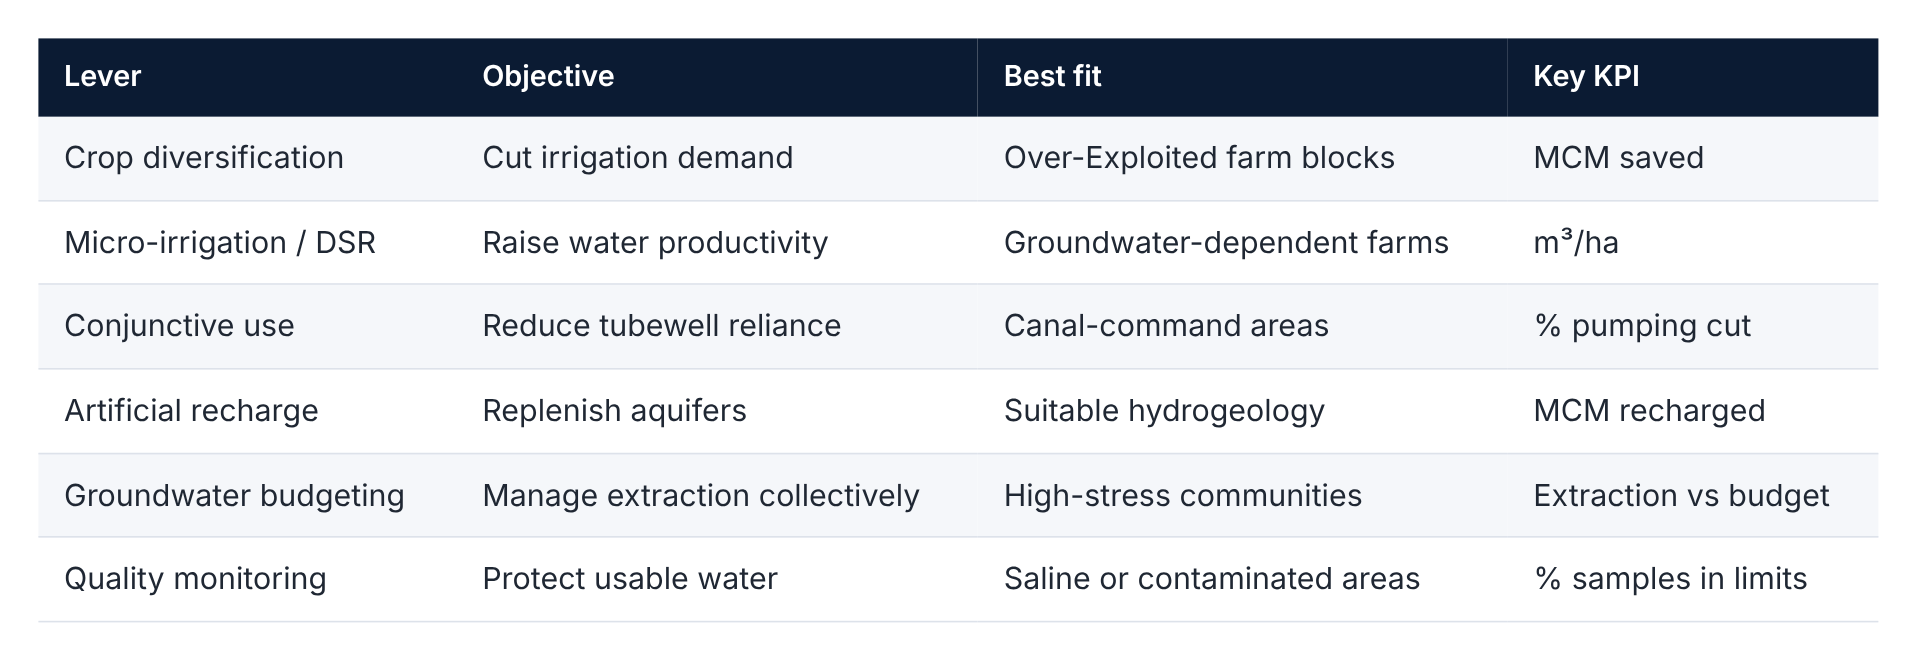
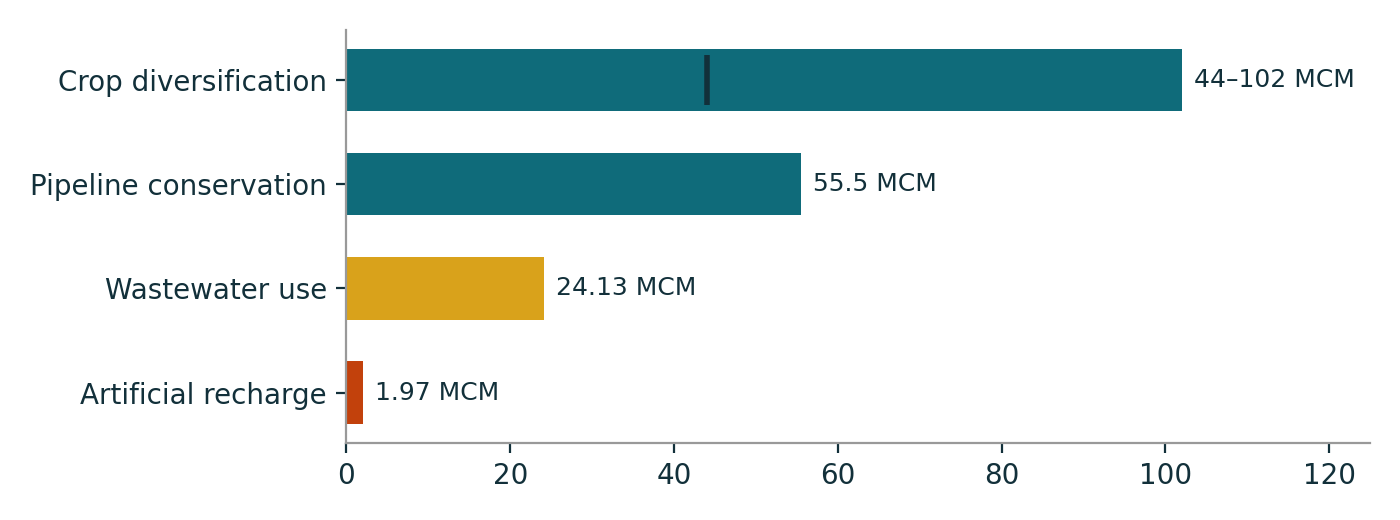
Figure 16. Indicative intervention potential, Hisar (MCM). Crop diversification is a 44–102 MCM range (marker = lower bound). These are historical study estimates, not achieved savings. Source: CGWB Hisar study [2].
Lever detail
Crop diversification. CGWB recommends moving Over-Exploited areas from paddy to millets, pulses and oilseeds, backed by price incentives and assured procurement.[1] HWRA lists diversification alongside efficient irrigation and recharge.[3] The state scheme Mera Pani Meri Virasat reportedly reached less than 20% of its diversification target in 2025, with farmers citing assured returns and procurement.[7] Incentives must link to reliable markets, procurement and measured groundwater outcomes.
DSR and efficient irrigation. Where paddy stays, cut its water intensity through DSR, micro-irrigation, laser land levelling and zero-tillage.[6] Track A: paddy to maize, pulses or oilseeds where feasible. Track B: flood irrigation to DSR plus better irrigation management. Micro-irrigation programmes should pay for measured water savings rather than equipment alone.
Conjunctive use. Hisar is 76.83% canal-irrigated and 23.17% groundwater-irrigated, so groundwater cannot be managed apart from canals. Use canal water where access is good and keep groundwater as a supplement elsewhere.[1][2]
Targeted recharge. HWRA recommends recharge, efficient irrigation, diversification, regulated withdrawals, alternative sources and treated wastewater or stormwater reuse.[3] Recharge where hydrogeology permits; cut extraction where it cannot keep up. In Hisar, demand-side measures dwarf the 1.97 MCM recharge estimate.[2]
Wastewater reuse. Hisar's plan estimated 24.13 MCM treatable through village ponds and reused for irrigation, linking groundwater to rural sanitation.[2]
Spatial targeting. HWRA 2025 integrates CGWB, Groundwater Cell, Irrigation, IMD, Agriculture, PHED and HARSAC data in GIS maps,[3] a base for a block-level Groundwater Risk Dashboard combining extraction, water levels, crops, rainfall, irrigation source and quality.
Recommended hierarchy: reduce extraction, improve efficiency, use surface water, then recharge suitable aquifers.
8. Prioritising where to act
We propose a composite priority score covering extraction stress, water-level decline, agricultural groundwater dependence, crop water intensity, water-quality risk and limited alternative water. The aim is to match intervention to place, not to label districts good or bad. The Atlas overlay in Section 4 gives a first district-level cut; block-level data should replace it before investment decisions.
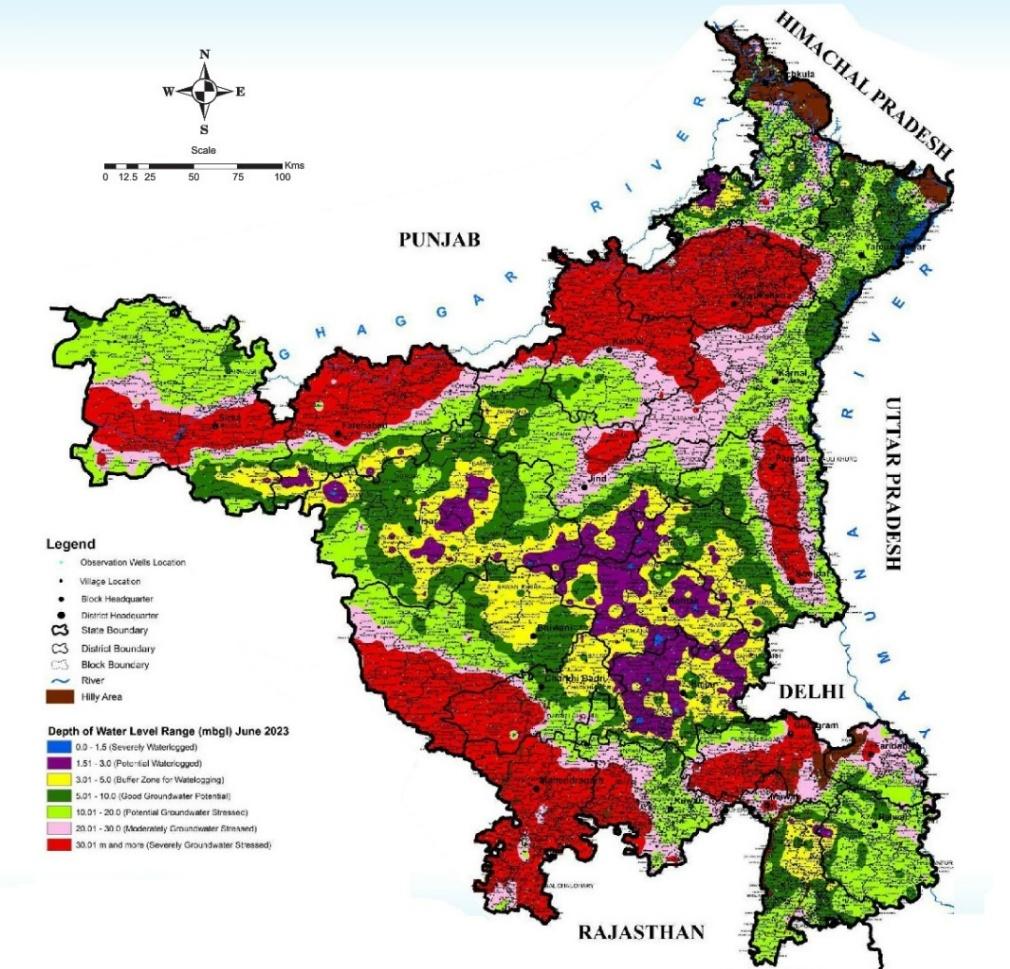
Figure 17. Depth to water level (pre-monsoon), June 2023, GWC Haryana, HARSAC / GIS based
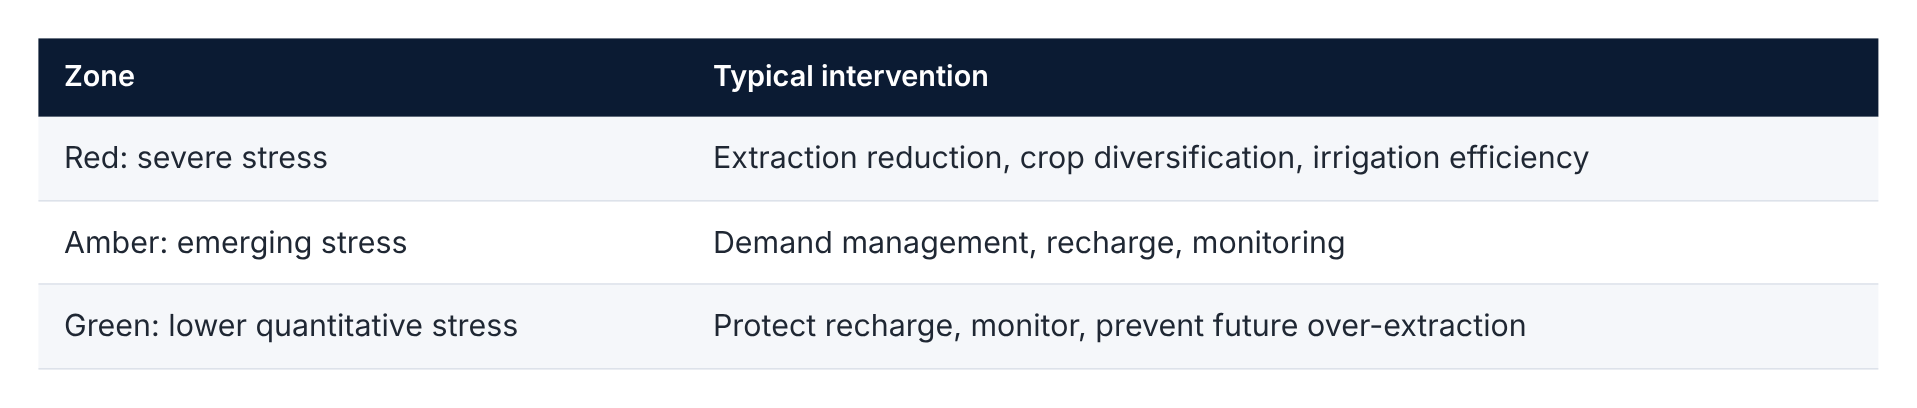
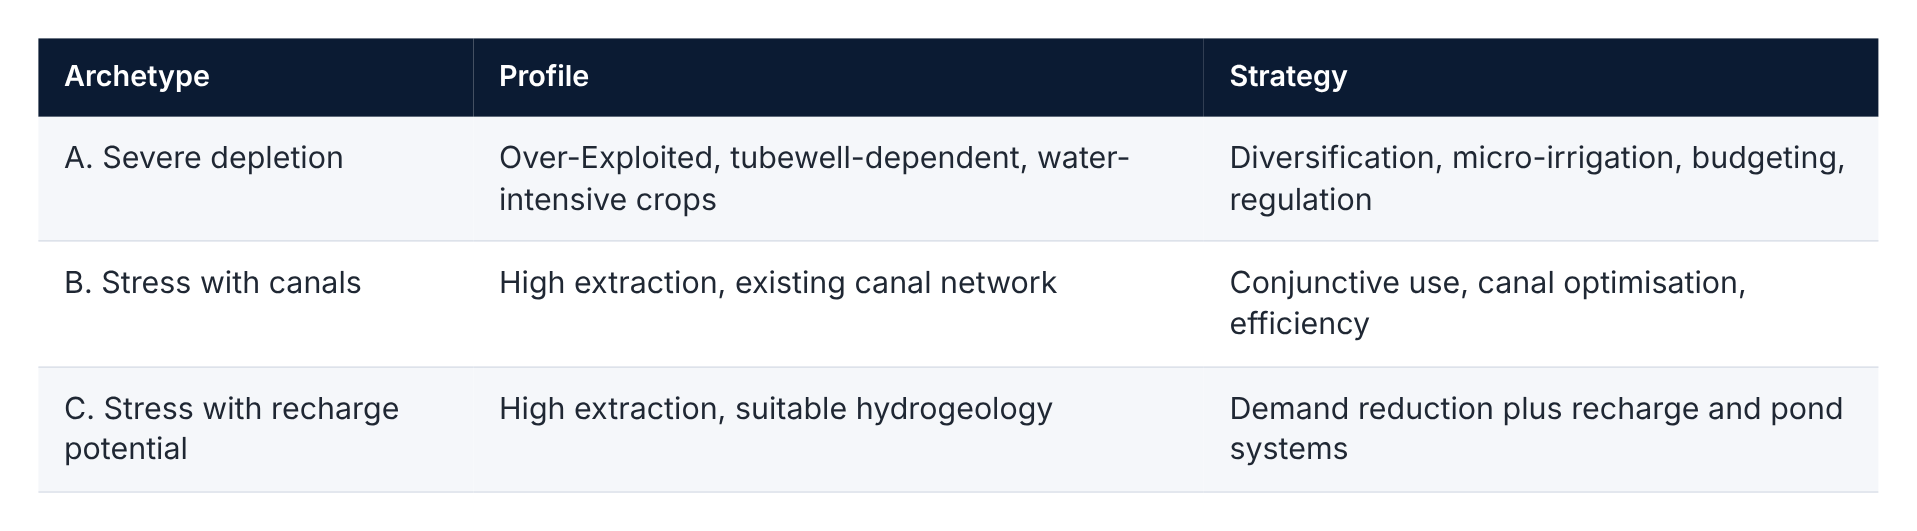
9. Why farmer economics must be central
Technology alone will not solve the problem. Paddy stays attractive for procurement, price certainty and familiarity, and the diversification shortfall shows a gap between government target and farmer adoption.[7] Sustainable adoption needs water saving plus income protection, market access, technology and monitoring. The economic chain of doing nothing runs from water-intensive cropping to excess extraction, deeper pumping, higher energy and irrigation costs, and greater farm vulnerability, while salinity and contamination shrink the usable share of what remains.[1]
10. Implementation roadmap
Diagnose (0–12 months): build a block-level groundwater intelligence system covering extraction, levels, rainfall, cropping, irrigation source, canals, quality and recharge potential, strengthening district groundwater cells as CGWB recommends.[1]
Pilot (years 1–2): test diversification, DSR, micro-irrigation, budgeting, conjunctive use, recharge and wastewater reuse in high-stress blocks (candidate districts we propose from the Atlas overlay: Kurukshetra, Kaithal, Karnal and Fatehabad for depletion-driven demand reduction; Mahendragarh, Charkhi Dadri and Faridabad for combined depletion and quality stress; Hisar for block-level work in Narnaud and the Hansi blocks), measuring outcomes rather than structures built.
Scale (years 3–5): expand only what shows measured groundwater savings, protected farmer incomes, strong adoption and cost-effectiveness.
Delivery needs the state government, CGWB, the Ground Water Cell, the agriculture and irrigation departments, panchayats, farmer groups and Water User Associations, as the 2025 report urges.[1]
11. KPI dashboard
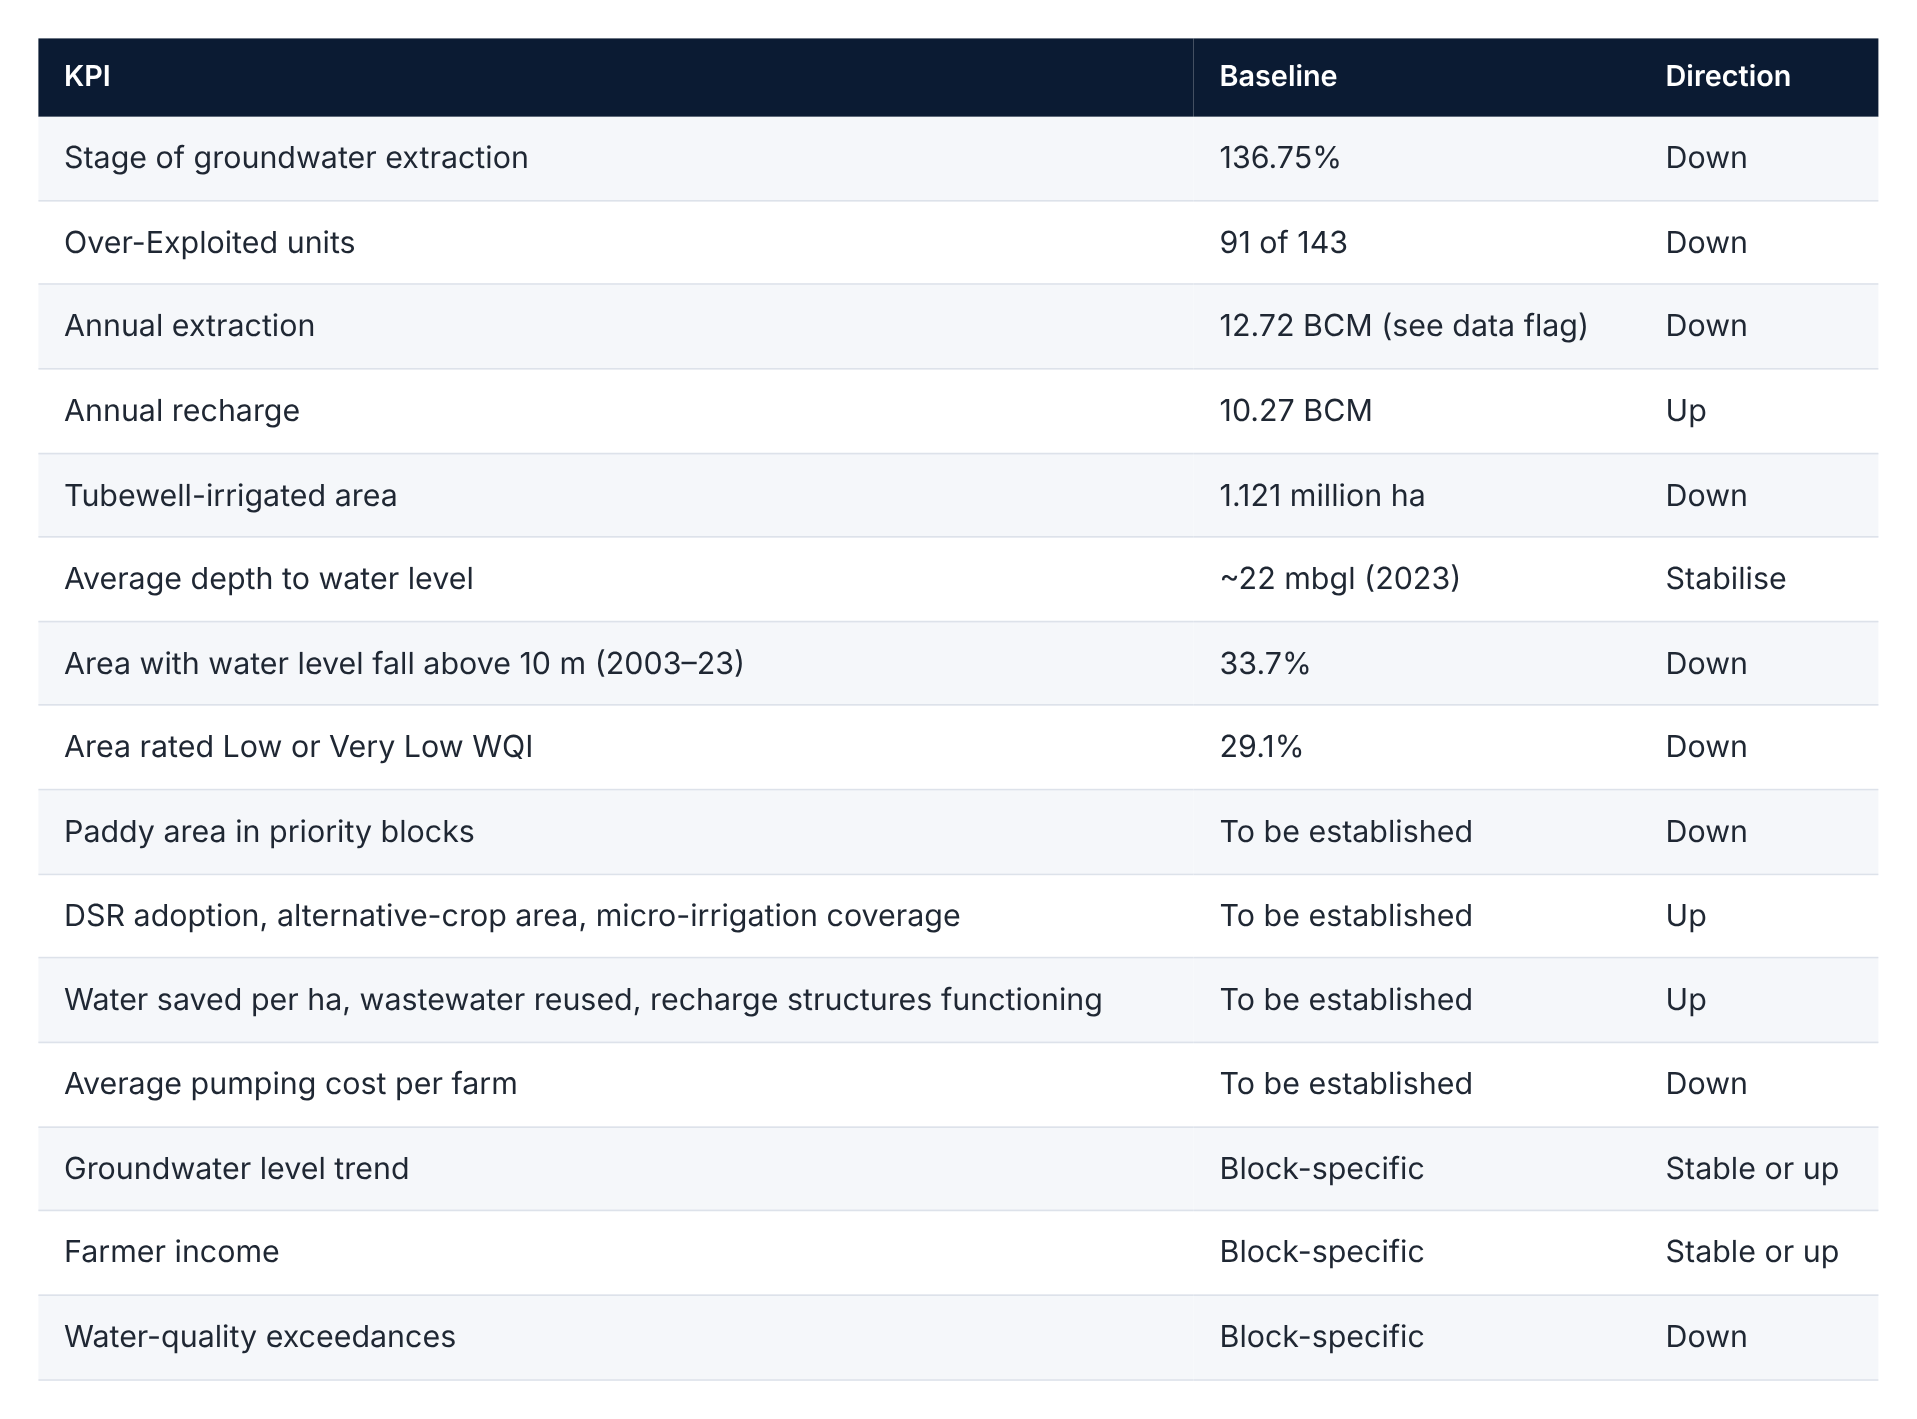
12. Recommendation
Treat this as an agricultural water-productivity challenge. Reduce demand through diversification in the most stressed blocks, raise productivity with DSR and efficient irrigation, optimise canal water, recharge only where hydrogeology supports it, and manage extraction through local budgets. Change incentives with assured procurement, crop-market development and farmer-level water accounting, and improve decisions with GIS risk mapping and block monitoring. The value of the work lies in finding where each rupee of intervention cuts groundwater stress most without undermining livelihoods.
The test of success: can Haryana produce equal or greater agricultural value with less groundwater?
Data notes and limitations
The 2025 CGWB report is the latest state baseline in the supplied material and contains the extraction discrepancy noted in Section 2.
Hisar data are historical (about 2013–2016). The 44–102 MCM, 55.5 MCM, 1.97 MCM and 24.13 MCM estimates are indicative potential, not achieved savings. CGWB's 112% Hisar stage uses that study's own methodology.
Newspaper figures (5.41 m decline, 88 of 143 blocks, +35% paddy, 87% water share, under 20% diversification) are press-reported and not verified against primary data.
Atlas-derived percentages and tile maps are our calculations from Atlas Tables 36 and 39; tiles are schematic, not district boundaries. The overlay thresholds (40% and 30%) are illustrative, and the WQI covers shallow aquifers only.
The Atlas 2024 block classification and the CGWB 2025 assessment are separate exercises, so changes between them are indicative.
Statewide figures mask large block-to-block variation.
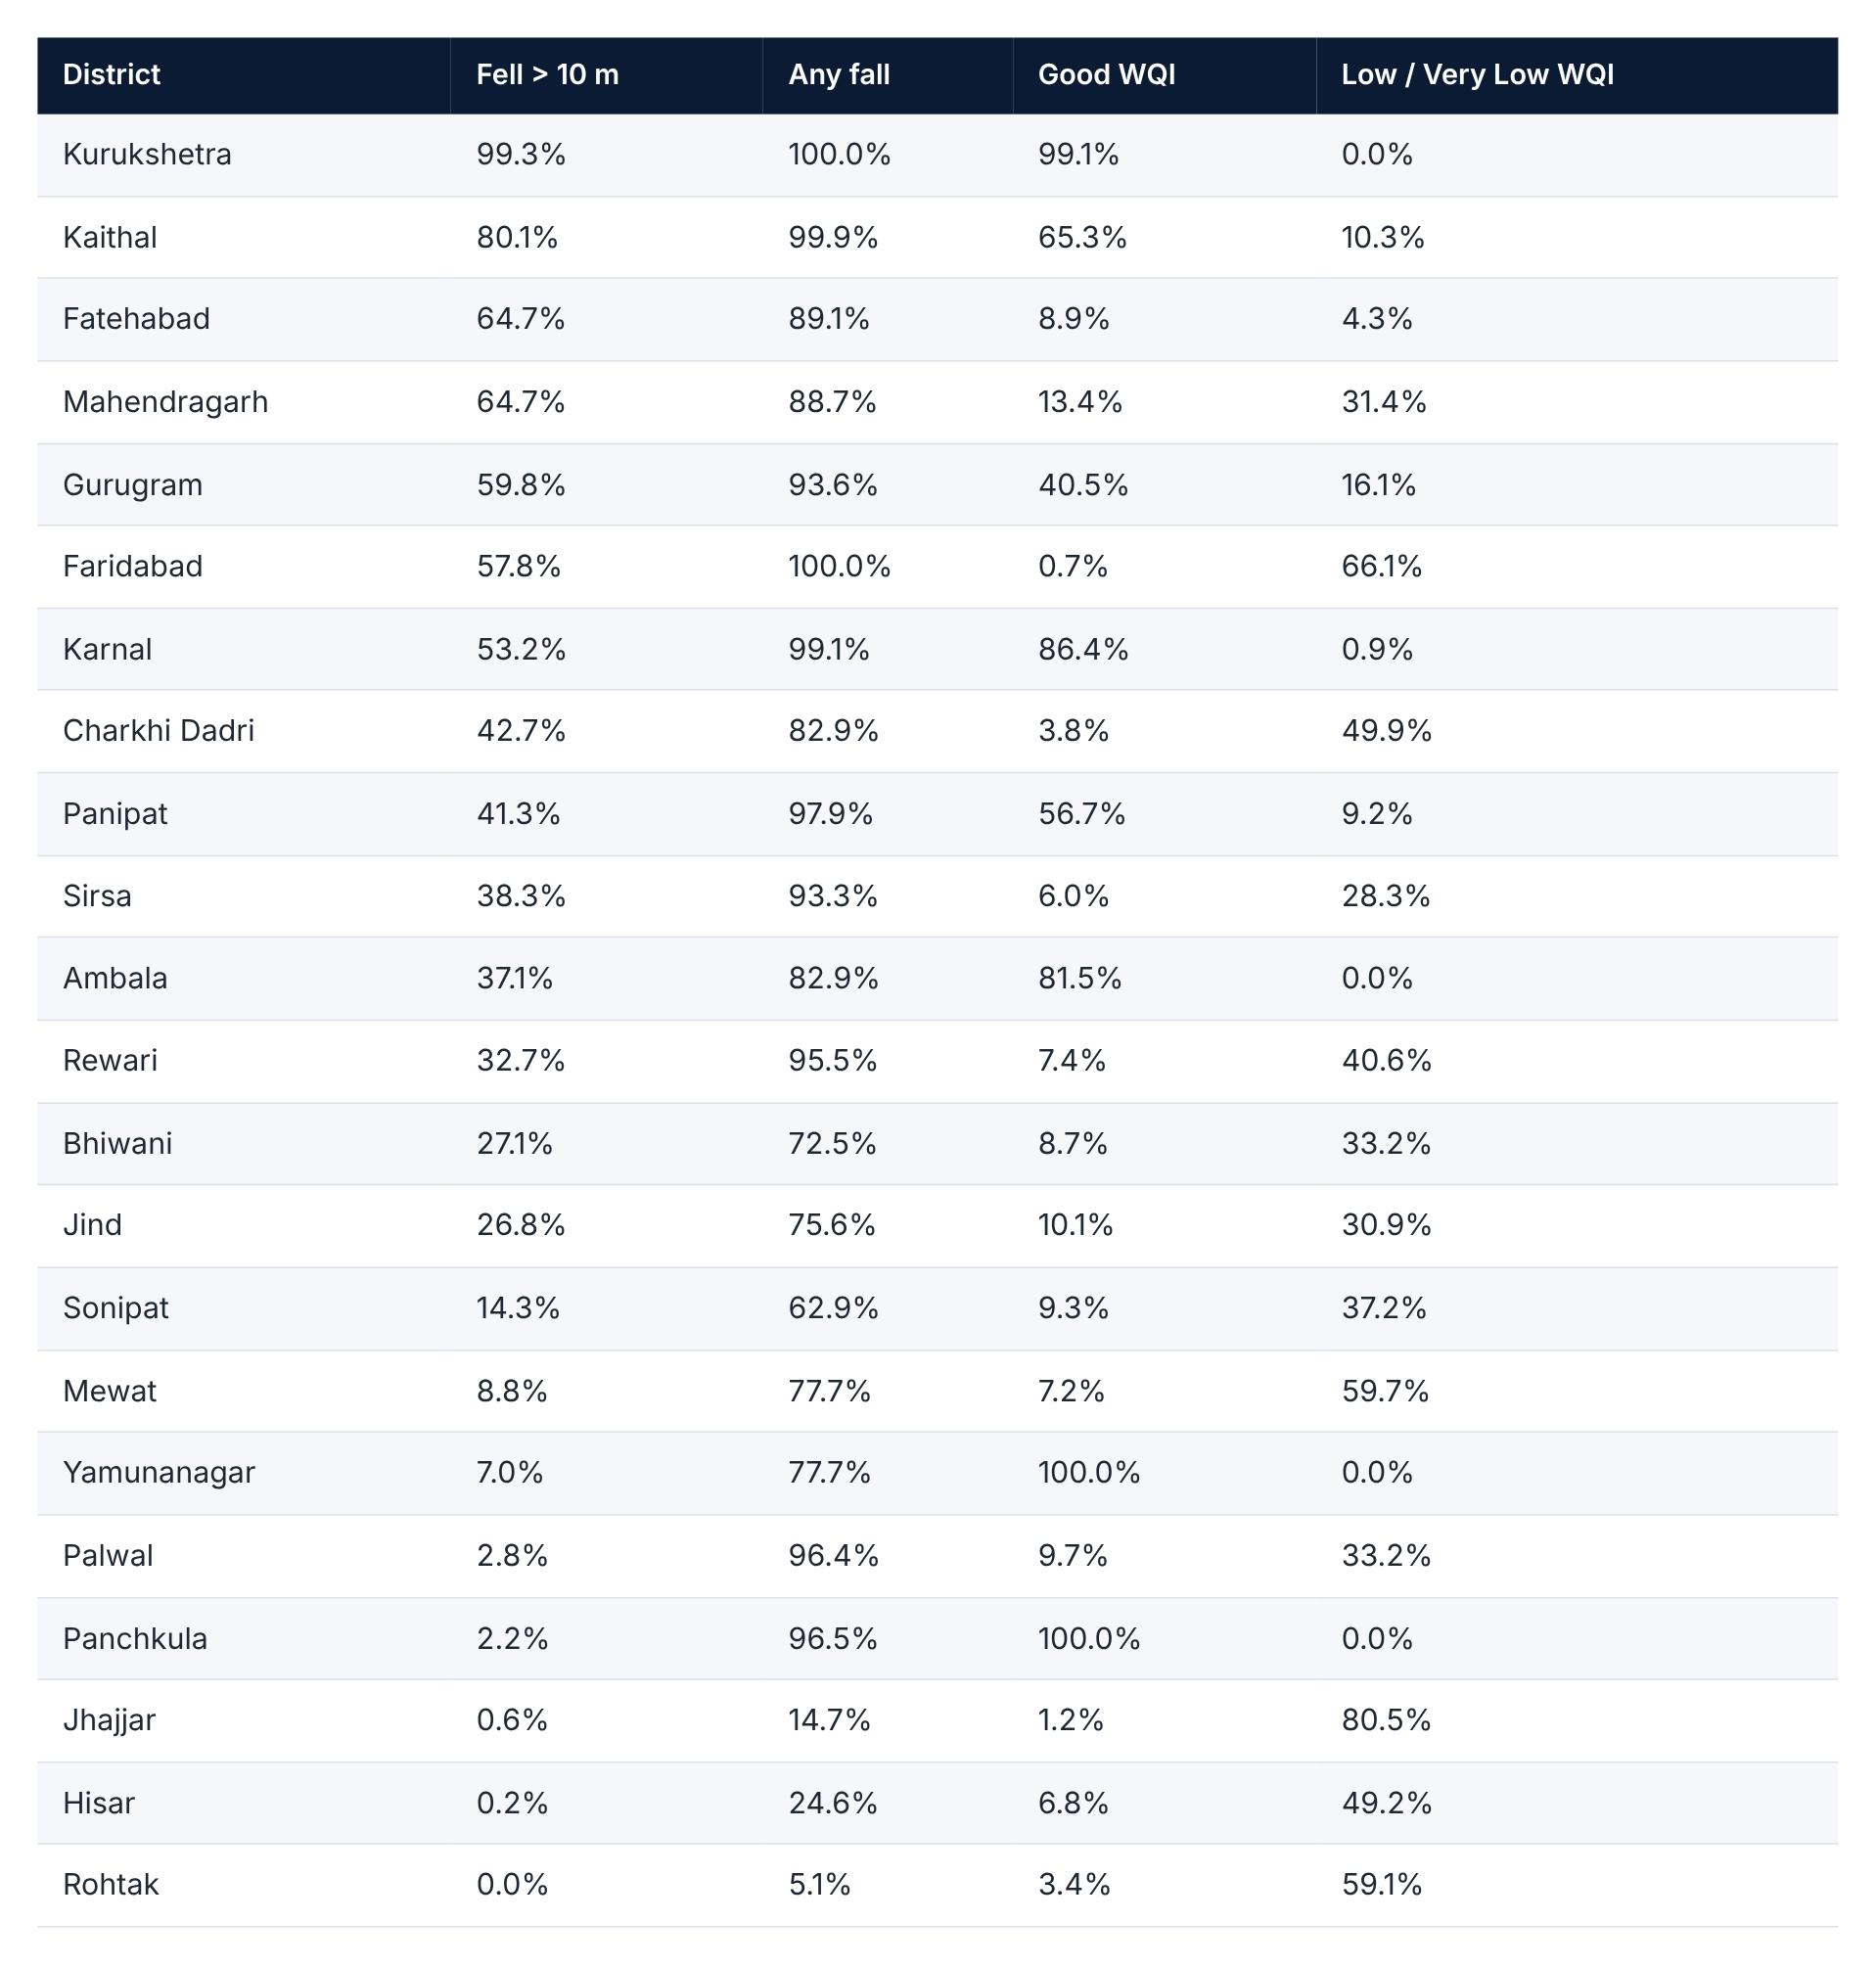
Appendix: district indicators from the Atlas
Sorted by the share of area where the water level fell more than 10 m (2003–2023). Source: HWRA (2025), Tables 36 and 39; our calculations [3].
References
Central Ground Water Board & Ground Water Cell, Haryana (2025). Dynamic Ground Water Resources of Haryana, 2025 (assessment year 2024–25).
Central Ground Water Board. Aquifer Mapping and Management Plan in Hisar District, Haryana State, India (2017; data about 2013–2016).
Haryana Water Resources Authority & HARSAC (2025). Haryana Water Resources Atlas 2025, pages 19, 45, 60, 64, 75, 79 and 83 (Tables 36 and 39; Figures 26–29, 37, 41 and 45). hwra.org.in/Atlas2025
The Indian Express (March 2025). "Ground water level down 5.41m in 10 yrs, Ambala most affected." indianexpress.com
The Indian Express (July 2025). "Despite govt's push for alternatives, water-guzzling paddy expands by 35% in Haryana in ten years." indianexpress.com
The Tribune (May 2024). "Crop diversification the key to arresting the slide." tribuneindia.com
The Tribune (December 2025). "Few takers for Haryana's crop diversification plan; only 20% of target achieved." tribuneindia.com